Cypriot vs Immigrants from Panama In Labor Force | Age 20-24
COMPARE
Cypriot
Immigrants from Panama
In Labor Force | Age 20-24
In Labor Force | Age 20-24 Comparison
Cypriots
Immigrants from Panama
73.3%
IN LABOR FORCE | AGE 20-24
0.2/ 100
METRIC RATING
278th/ 347
METRIC RANK
73.9%
IN LABOR FORCE | AGE 20-24
1.6/ 100
METRIC RATING
246th/ 347
METRIC RANK
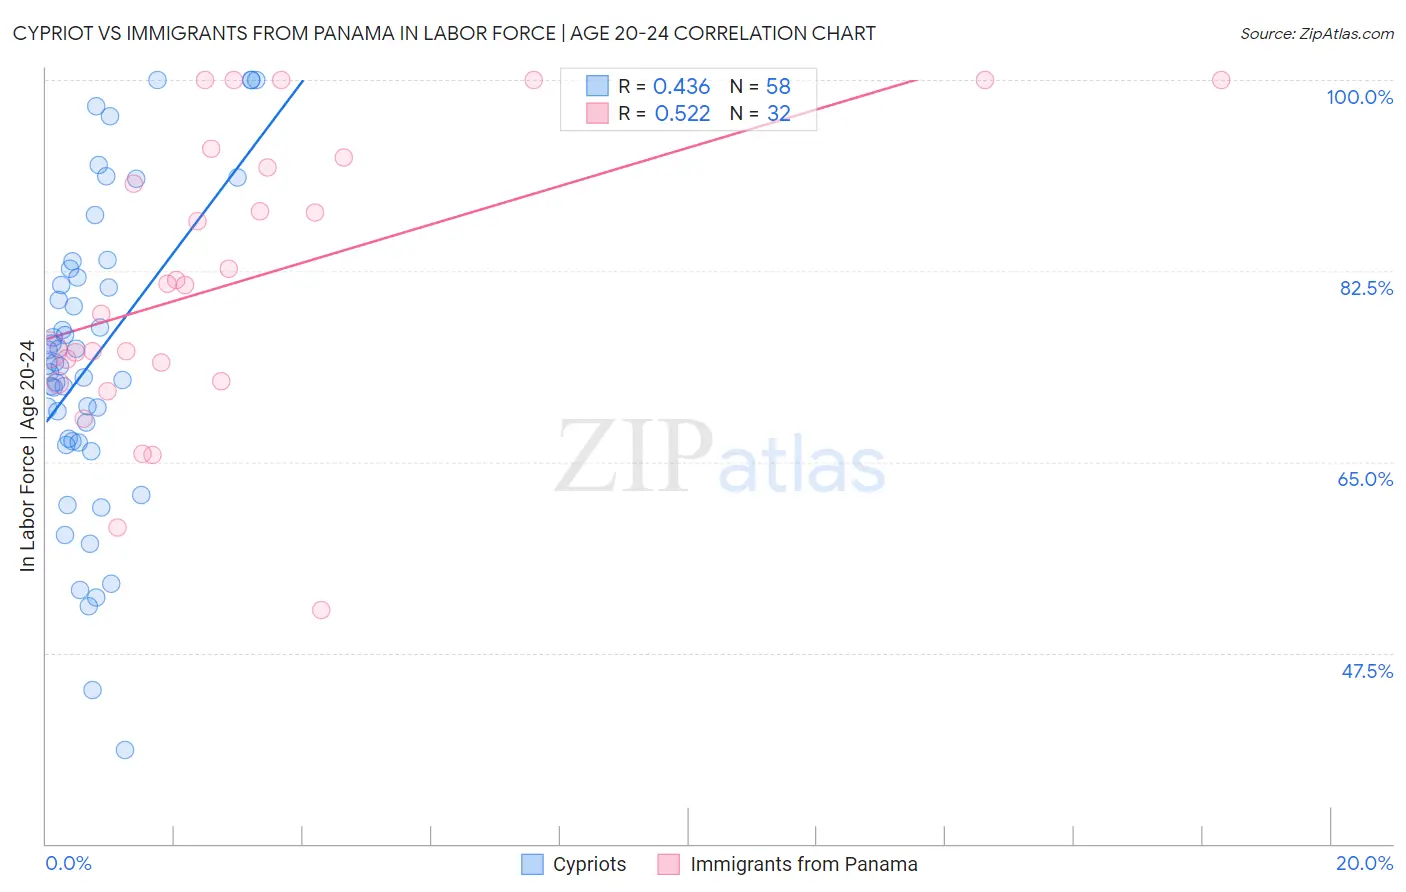
Cypriot vs Immigrants from Panama In Labor Force | Age 20-24 Correlation Chart
The statistical analysis conducted on geographies consisting of 61,866,486 people shows a moderate positive correlation between the proportion of Cypriots and labor force participation rate among population between the ages 20 and 24 in the United States with a correlation coefficient (R) of 0.436 and weighted average of 73.3%. Similarly, the statistical analysis conducted on geographies consisting of 221,162,979 people shows a substantial positive correlation between the proportion of Immigrants from Panama and labor force participation rate among population between the ages 20 and 24 in the United States with a correlation coefficient (R) of 0.522 and weighted average of 73.9%, a difference of 0.82%.
In Labor Force | Age 20-24 Correlation Summary
| Measurement | Cypriot | Immigrants from Panama |
| Minimum | 38.6% | 51.4% |
| Maximum | 100.0% | 100.0% |
| Range | 61.4% | 48.6% |
| Mean | 74.4% | 81.7% |
| Median | 73.9% | 81.3% |
| Interquartile 25% (IQ1) | 66.9% | 73.3% |
| Interquartile 75% (IQ3) | 81.9% | 92.4% |
| Interquartile Range (IQR) | 15.0% | 19.2% |
| Standard Deviation (Sample) | 13.9% | 13.0% |
| Standard Deviation (Population) | 13.8% | 12.8% |
Similar Demographics by In Labor Force | Age 20-24
Demographics Similar to Cypriots by In Labor Force | Age 20-24
In terms of in labor force | age 20-24, the demographic groups most similar to Cypriots are Venezuelan (73.3%, a difference of 0.010%), Immigrants from Malaysia (73.3%, a difference of 0.020%), Mongolian (73.3%, a difference of 0.030%), Immigrants from South America (73.3%, a difference of 0.040%), and Bahamian (73.3%, a difference of 0.080%).
| Demographics | Rating | Rank | In Labor Force | Age 20-24 |
| Immigrants | Indonesia | 0.3 /100 | #271 | Tragic 73.4% |
| Belizeans | 0.3 /100 | #272 | Tragic 73.4% |
| Cheyenne | 0.2 /100 | #273 | Tragic 73.4% |
| Immigrants | Colombia | 0.2 /100 | #274 | Tragic 73.4% |
| Immigrants | South America | 0.2 /100 | #275 | Tragic 73.3% |
| Mongolians | 0.2 /100 | #276 | Tragic 73.3% |
| Immigrants | Malaysia | 0.2 /100 | #277 | Tragic 73.3% |
| Cypriots | 0.2 /100 | #278 | Tragic 73.3% |
| Venezuelans | 0.2 /100 | #279 | Tragic 73.3% |
| Bahamians | 0.1 /100 | #280 | Tragic 73.3% |
| Immigrants | Venezuela | 0.1 /100 | #281 | Tragic 73.2% |
| Immigrants | Spain | 0.1 /100 | #282 | Tragic 73.2% |
| Immigrants | Bahamas | 0.1 /100 | #283 | Tragic 73.2% |
| Kiowa | 0.1 /100 | #284 | Tragic 73.2% |
| Nicaraguans | 0.1 /100 | #285 | Tragic 73.2% |
Demographics Similar to Immigrants from Panama by In Labor Force | Age 20-24
In terms of in labor force | age 20-24, the demographic groups most similar to Immigrants from Panama are Colville (73.9%, a difference of 0.030%), Immigrants from Saudi Arabia (73.9%, a difference of 0.030%), Turkish (73.9%, a difference of 0.040%), Immigrants from South Central Asia (74.0%, a difference of 0.060%), and Immigrants from Syria (74.0%, a difference of 0.070%).
| Demographics | Rating | Rank | In Labor Force | Age 20-24 |
| Immigrants | Latin America | 2.7 /100 | #239 | Tragic 74.1% |
| Immigrants | Sri Lanka | 2.3 /100 | #240 | Tragic 74.0% |
| Immigrants | Senegal | 2.1 /100 | #241 | Tragic 74.0% |
| Thais | 2.1 /100 | #242 | Tragic 74.0% |
| Immigrants | Syria | 1.9 /100 | #243 | Tragic 74.0% |
| Immigrants | South Central Asia | 1.9 /100 | #244 | Tragic 74.0% |
| Turks | 1.8 /100 | #245 | Tragic 73.9% |
| Immigrants | Panama | 1.6 /100 | #246 | Tragic 73.9% |
| Colville | 1.5 /100 | #247 | Tragic 73.9% |
| Immigrants | Saudi Arabia | 1.5 /100 | #248 | Tragic 73.9% |
| Blacks/African Americans | 1.3 /100 | #249 | Tragic 73.9% |
| Immigrants | Belgium | 1.3 /100 | #250 | Tragic 73.9% |
| Immigrants | Egypt | 1.2 /100 | #251 | Tragic 73.8% |
| Immigrants | Kazakhstan | 1.1 /100 | #252 | Tragic 73.8% |
| Arapaho | 1.0 /100 | #253 | Tragic 73.8% |