Cypriot vs Immigrants from Panama High School Diploma
COMPARE
Cypriot
Immigrants from Panama
High School Diploma
High School Diploma Comparison
Cypriots
Immigrants from Panama
91.5%
HIGH SCHOOL DIPLOMA
99.9/ 100
METRIC RATING
27th/ 347
METRIC RANK
88.0%
HIGH SCHOOL DIPLOMA
3.1/ 100
METRIC RATING
233rd/ 347
METRIC RANK
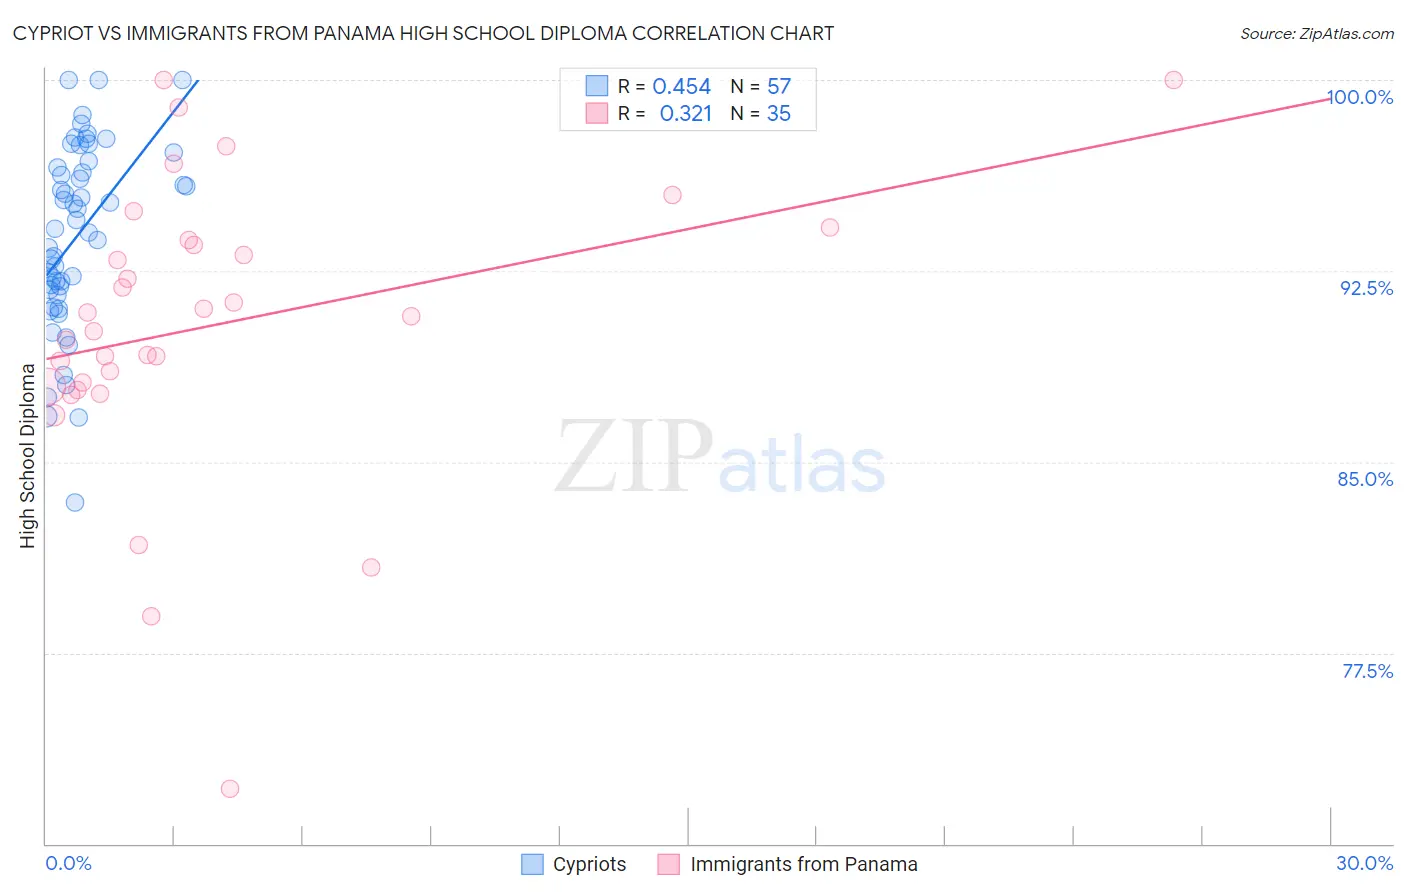
Cypriot vs Immigrants from Panama High School Diploma Correlation Chart
The statistical analysis conducted on geographies consisting of 61,870,289 people shows a moderate positive correlation between the proportion of Cypriots and percentage of population with at least high school diploma education in the United States with a correlation coefficient (R) of 0.454 and weighted average of 91.5%. Similarly, the statistical analysis conducted on geographies consisting of 221,182,871 people shows a mild positive correlation between the proportion of Immigrants from Panama and percentage of population with at least high school diploma education in the United States with a correlation coefficient (R) of 0.321 and weighted average of 88.0%, a difference of 4.0%.
High School Diploma Correlation Summary
| Measurement | Cypriot | Immigrants from Panama |
| Minimum | 83.4% | 72.1% |
| Maximum | 100.0% | 100.0% |
| Range | 16.6% | 27.9% |
| Mean | 93.9% | 90.4% |
| Median | 94.2% | 90.7% |
| Interquartile 25% (IQ1) | 91.7% | 88.0% |
| Interquartile 75% (IQ3) | 96.7% | 93.7% |
| Interquartile Range (IQR) | 5.0% | 5.7% |
| Standard Deviation (Sample) | 3.7% | 5.8% |
| Standard Deviation (Population) | 3.6% | 5.7% |
Similar Demographics by High School Diploma
Demographics Similar to Cypriots by High School Diploma
In terms of high school diploma, the demographic groups most similar to Cypriots are Russian (91.5%, a difference of 0.010%), Tlingit-Haida (91.4%, a difference of 0.030%), European (91.4%, a difference of 0.050%), Thai (91.5%, a difference of 0.060%), and Iranian (91.4%, a difference of 0.060%).
| Demographics | Rating | Rank | High School Diploma |
| Czechs | 99.9 /100 | #20 | Exceptional 91.6% |
| Filipinos | 99.9 /100 | #21 | Exceptional 91.6% |
| Estonians | 99.9 /100 | #22 | Exceptional 91.6% |
| Scandinavians | 99.9 /100 | #23 | Exceptional 91.5% |
| Italians | 99.9 /100 | #24 | Exceptional 91.5% |
| Thais | 99.9 /100 | #25 | Exceptional 91.5% |
| Russians | 99.9 /100 | #26 | Exceptional 91.5% |
| Cypriots | 99.9 /100 | #27 | Exceptional 91.5% |
| Tlingit-Haida | 99.9 /100 | #28 | Exceptional 91.4% |
| Europeans | 99.9 /100 | #29 | Exceptional 91.4% |
| Iranians | 99.9 /100 | #30 | Exceptional 91.4% |
| Immigrants | Northern Europe | 99.9 /100 | #31 | Exceptional 91.4% |
| English | 99.9 /100 | #32 | Exceptional 91.4% |
| Okinawans | 99.9 /100 | #33 | Exceptional 91.4% |
| Scottish | 99.9 /100 | #34 | Exceptional 91.4% |
Demographics Similar to Immigrants from Panama by High School Diploma
In terms of high school diploma, the demographic groups most similar to Immigrants from Panama are Immigrants from Thailand (88.0%, a difference of 0.010%), Immigrants from Bahamas (88.0%, a difference of 0.020%), Immigrants from Middle Africa (88.0%, a difference of 0.040%), Subsaharan African (87.9%, a difference of 0.040%), and Taiwanese (87.9%, a difference of 0.050%).
| Demographics | Rating | Rank | High School Diploma |
| Uruguayans | 5.6 /100 | #226 | Tragic 88.2% |
| Immigrants | Liberia | 5.5 /100 | #227 | Tragic 88.2% |
| Kiowa | 5.3 /100 | #228 | Tragic 88.2% |
| Nigerians | 5.2 /100 | #229 | Tragic 88.2% |
| Blackfeet | 4.2 /100 | #230 | Tragic 88.1% |
| Colombians | 3.8 /100 | #231 | Tragic 88.1% |
| Immigrants | Middle Africa | 3.4 /100 | #232 | Tragic 88.0% |
| Immigrants | Panama | 3.1 /100 | #233 | Tragic 88.0% |
| Immigrants | Thailand | 3.1 /100 | #234 | Tragic 88.0% |
| Immigrants | Bahamas | 2.9 /100 | #235 | Tragic 88.0% |
| Sub-Saharan Africans | 2.8 /100 | #236 | Tragic 87.9% |
| Taiwanese | 2.8 /100 | #237 | Tragic 87.9% |
| Sioux | 2.7 /100 | #238 | Tragic 87.9% |
| South Americans | 2.7 /100 | #239 | Tragic 87.9% |
| Comanche | 2.2 /100 | #240 | Tragic 87.9% |