Cypriot vs Immigrants from Syria 1 or more Vehicles in Household
COMPARE
Cypriot
Immigrants from Syria
1 or more Vehicles in Household
1 or more Vehicles in Household Comparison
Cypriots
Immigrants from Syria
84.4%
1 OR MORE VEHICLES IN HOUSEHOLD
0.0/ 100
METRIC RATING
315th/ 347
METRIC RANK
90.4%
1 OR MORE VEHICLES IN HOUSEHOLD
87.5/ 100
METRIC RATING
133rd/ 347
METRIC RANK
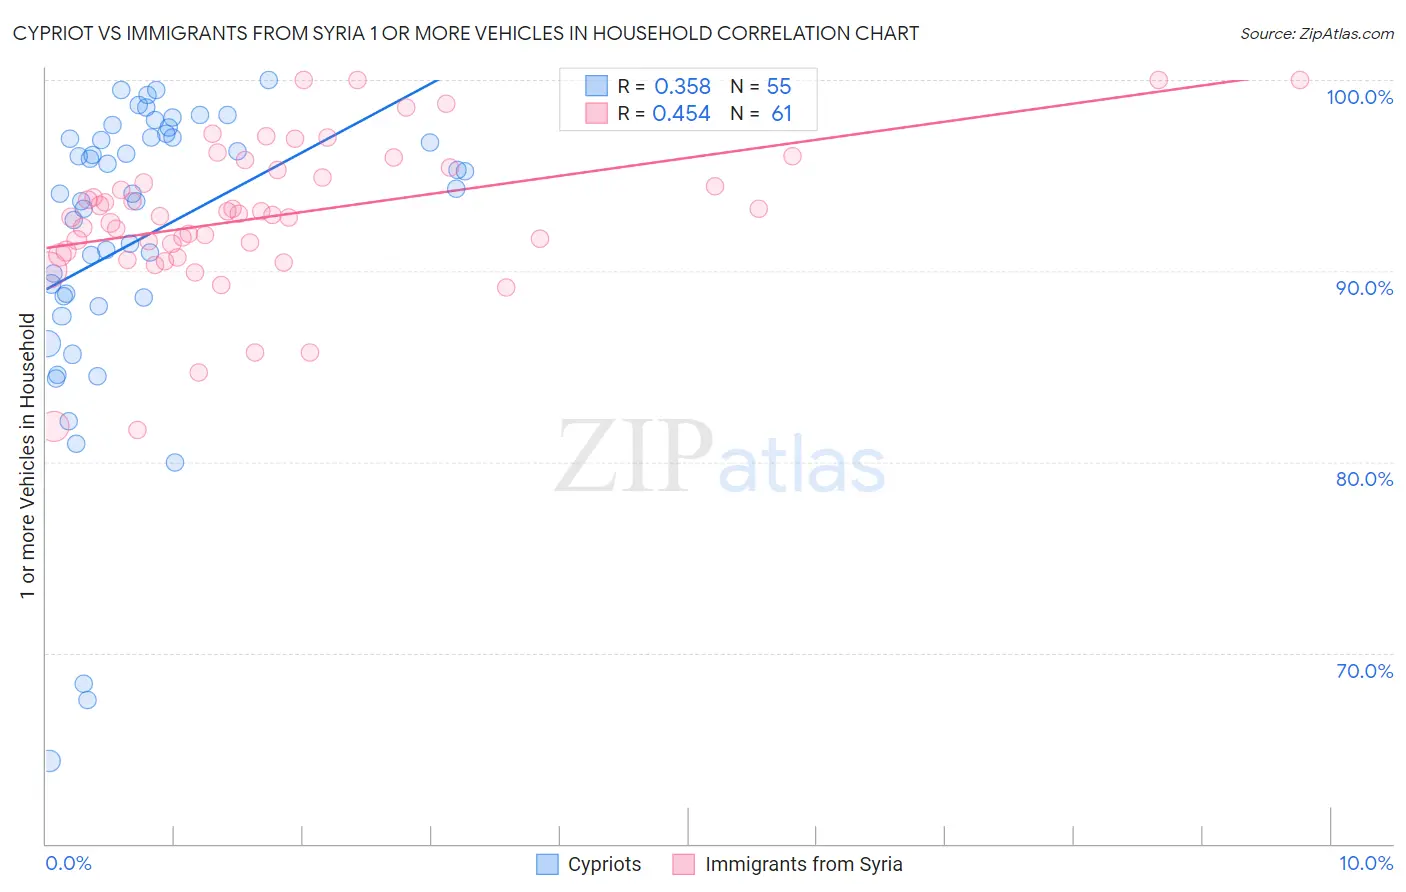
Cypriot vs Immigrants from Syria 1 or more Vehicles in Household Correlation Chart
The statistical analysis conducted on geographies consisting of 61,854,678 people shows a mild positive correlation between the proportion of Cypriots and percentage of households with 1 or more vehicles available in the United States with a correlation coefficient (R) of 0.358 and weighted average of 84.4%. Similarly, the statistical analysis conducted on geographies consisting of 174,034,006 people shows a moderate positive correlation between the proportion of Immigrants from Syria and percentage of households with 1 or more vehicles available in the United States with a correlation coefficient (R) of 0.454 and weighted average of 90.4%, a difference of 7.1%.
1 or more Vehicles in Household Correlation Summary
| Measurement | Cypriot | Immigrants from Syria |
| Minimum | 64.3% | 81.7% |
| Maximum | 100.0% | 100.0% |
| Range | 35.7% | 18.3% |
| Mean | 91.6% | 92.9% |
| Median | 94.0% | 92.9% |
| Interquartile 25% (IQ1) | 88.6% | 90.9% |
| Interquartile 75% (IQ3) | 97.0% | 95.3% |
| Interquartile Range (IQR) | 8.4% | 4.4% |
| Standard Deviation (Sample) | 8.0% | 3.9% |
| Standard Deviation (Population) | 7.9% | 3.9% |
Similar Demographics by 1 or more Vehicles in Household
Demographics Similar to Cypriots by 1 or more Vehicles in Household
In terms of 1 or more vehicles in household, the demographic groups most similar to Cypriots are Albanian (84.4%, a difference of 0.070%), Immigrants from Israel (84.5%, a difference of 0.13%), Cape Verdean (84.5%, a difference of 0.16%), Puerto Rican (84.6%, a difference of 0.27%), and U.S. Virgin Islander (84.6%, a difference of 0.30%).
| Demographics | Rating | Rank | 1 or more Vehicles in Household |
| Immigrants | Belize | 0.0 /100 | #308 | Tragic 84.7% |
| Immigrants | Haiti | 0.0 /100 | #309 | Tragic 84.7% |
| U.S. Virgin Islanders | 0.0 /100 | #310 | Tragic 84.6% |
| Puerto Ricans | 0.0 /100 | #311 | Tragic 84.6% |
| Cape Verdeans | 0.0 /100 | #312 | Tragic 84.5% |
| Immigrants | Israel | 0.0 /100 | #313 | Tragic 84.5% |
| Albanians | 0.0 /100 | #314 | Tragic 84.4% |
| Cypriots | 0.0 /100 | #315 | Tragic 84.4% |
| Alaska Natives | 0.0 /100 | #316 | Tragic 83.8% |
| Ghanaians | 0.0 /100 | #317 | Tragic 83.6% |
| Immigrants | Ghana | 0.0 /100 | #318 | Tragic 83.4% |
| Immigrants | Belarus | 0.0 /100 | #319 | Tragic 83.3% |
| Soviet Union | 0.0 /100 | #320 | Tragic 82.7% |
| Jamaicans | 0.0 /100 | #321 | Tragic 82.1% |
| Immigrants | Cabo Verde | 0.0 /100 | #322 | Tragic 81.6% |
Demographics Similar to Immigrants from Syria by 1 or more Vehicles in Household
In terms of 1 or more vehicles in household, the demographic groups most similar to Immigrants from Syria are Immigrants from South Africa (90.4%, a difference of 0.020%), Kenyan (90.4%, a difference of 0.020%), Immigrants from Oceania (90.4%, a difference of 0.020%), Immigrants from Kenya (90.4%, a difference of 0.040%), and Hungarian (90.3%, a difference of 0.040%).
| Demographics | Rating | Rank | 1 or more Vehicles in Household |
| Immigrants | Cameroon | 89.4 /100 | #126 | Excellent 90.4% |
| Immigrants | Azores | 89.1 /100 | #127 | Excellent 90.4% |
| Burmese | 89.0 /100 | #128 | Excellent 90.4% |
| Marshallese | 88.9 /100 | #129 | Excellent 90.4% |
| Nicaraguans | 88.8 /100 | #130 | Excellent 90.4% |
| Immigrants | Kenya | 88.5 /100 | #131 | Excellent 90.4% |
| Immigrants | South Africa | 88.1 /100 | #132 | Excellent 90.4% |
| Immigrants | Syria | 87.5 /100 | #133 | Excellent 90.4% |
| Kenyans | 87.0 /100 | #134 | Excellent 90.4% |
| Immigrants | Oceania | 86.9 /100 | #135 | Excellent 90.4% |
| Hungarians | 86.5 /100 | #136 | Excellent 90.3% |
| Latvians | 86.3 /100 | #137 | Excellent 90.3% |
| Syrians | 86.3 /100 | #138 | Excellent 90.3% |
| Estonians | 85.6 /100 | #139 | Excellent 90.3% |
| Sudanese | 85.2 /100 | #140 | Excellent 90.3% |