Cypriot vs Immigrants from Kuwait 1 or more Vehicles in Household
COMPARE
Cypriot
Immigrants from Kuwait
1 or more Vehicles in Household
1 or more Vehicles in Household Comparison
Cypriots
Immigrants from Kuwait
84.4%
1 OR MORE VEHICLES IN HOUSEHOLD
0.0/ 100
METRIC RATING
315th/ 347
METRIC RANK
90.7%
1 OR MORE VEHICLES IN HOUSEHOLD
94.7/ 100
METRIC RATING
113th/ 347
METRIC RANK
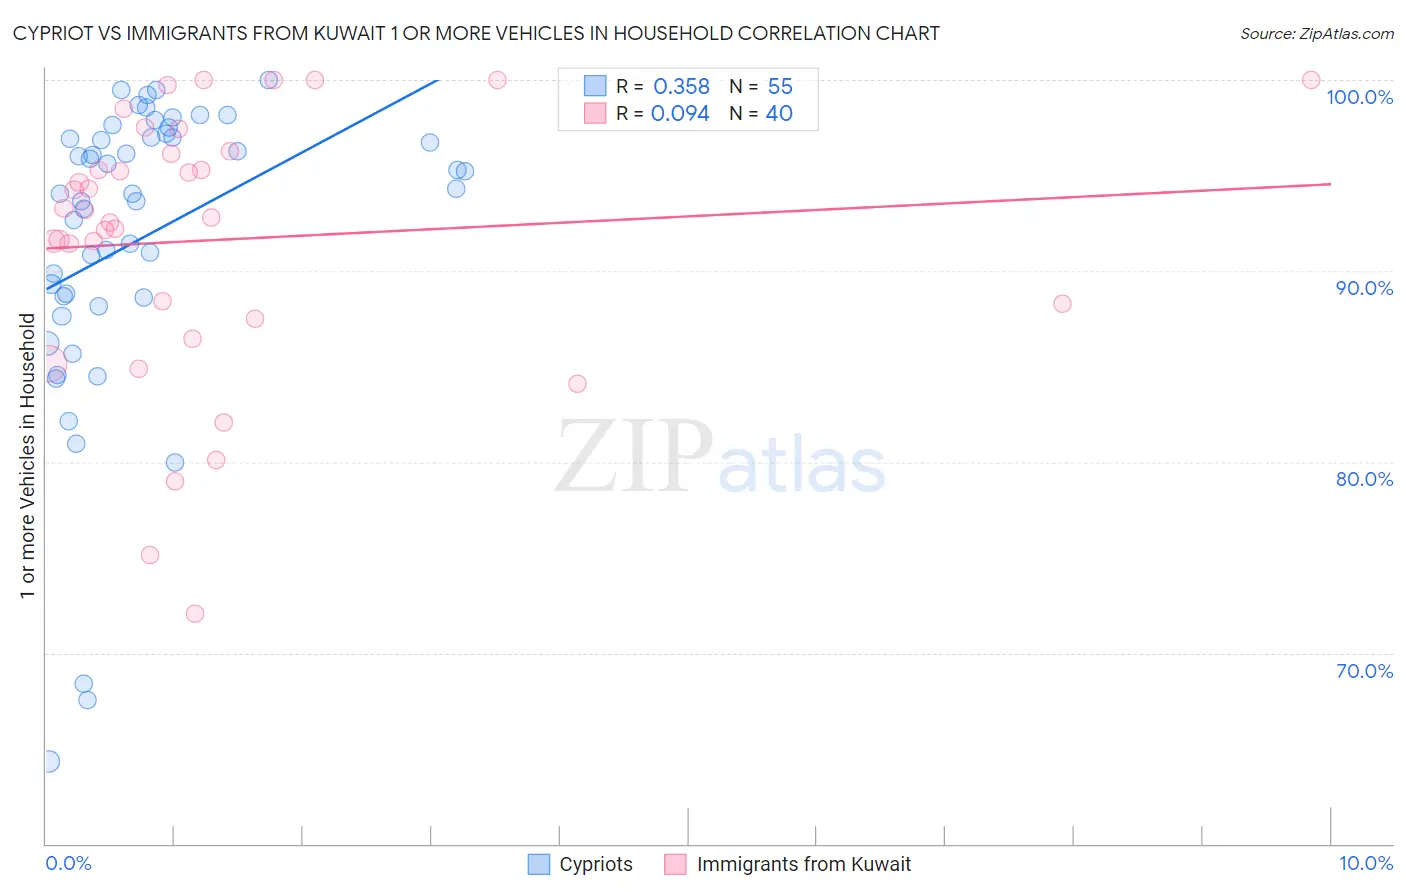
Cypriot vs Immigrants from Kuwait 1 or more Vehicles in Household Correlation Chart
The statistical analysis conducted on geographies consisting of 61,854,678 people shows a mild positive correlation between the proportion of Cypriots and percentage of households with 1 or more vehicles available in the United States with a correlation coefficient (R) of 0.358 and weighted average of 84.4%. Similarly, the statistical analysis conducted on geographies consisting of 136,852,839 people shows a slight positive correlation between the proportion of Immigrants from Kuwait and percentage of households with 1 or more vehicles available in the United States with a correlation coefficient (R) of 0.094 and weighted average of 90.7%, a difference of 7.5%.
1 or more Vehicles in Household Correlation Summary
| Measurement | Cypriot | Immigrants from Kuwait |
| Minimum | 64.3% | 72.1% |
| Maximum | 100.0% | 100.0% |
| Range | 35.7% | 27.9% |
| Mean | 91.6% | 91.6% |
| Median | 94.0% | 93.0% |
| Interquartile 25% (IQ1) | 88.6% | 87.9% |
| Interquartile 75% (IQ3) | 97.0% | 96.2% |
| Interquartile Range (IQR) | 8.4% | 8.3% |
| Standard Deviation (Sample) | 8.0% | 7.0% |
| Standard Deviation (Population) | 7.9% | 6.9% |
Similar Demographics by 1 or more Vehicles in Household
Demographics Similar to Cypriots by 1 or more Vehicles in Household
In terms of 1 or more vehicles in household, the demographic groups most similar to Cypriots are Albanian (84.4%, a difference of 0.070%), Immigrants from Israel (84.5%, a difference of 0.13%), Cape Verdean (84.5%, a difference of 0.16%), Puerto Rican (84.6%, a difference of 0.27%), and U.S. Virgin Islander (84.6%, a difference of 0.30%).
| Demographics | Rating | Rank | 1 or more Vehicles in Household |
| Immigrants | Belize | 0.0 /100 | #308 | Tragic 84.7% |
| Immigrants | Haiti | 0.0 /100 | #309 | Tragic 84.7% |
| U.S. Virgin Islanders | 0.0 /100 | #310 | Tragic 84.6% |
| Puerto Ricans | 0.0 /100 | #311 | Tragic 84.6% |
| Cape Verdeans | 0.0 /100 | #312 | Tragic 84.5% |
| Immigrants | Israel | 0.0 /100 | #313 | Tragic 84.5% |
| Albanians | 0.0 /100 | #314 | Tragic 84.4% |
| Cypriots | 0.0 /100 | #315 | Tragic 84.4% |
| Alaska Natives | 0.0 /100 | #316 | Tragic 83.8% |
| Ghanaians | 0.0 /100 | #317 | Tragic 83.6% |
| Immigrants | Ghana | 0.0 /100 | #318 | Tragic 83.4% |
| Immigrants | Belarus | 0.0 /100 | #319 | Tragic 83.3% |
| Soviet Union | 0.0 /100 | #320 | Tragic 82.7% |
| Jamaicans | 0.0 /100 | #321 | Tragic 82.1% |
| Immigrants | Cabo Verde | 0.0 /100 | #322 | Tragic 81.6% |
Demographics Similar to Immigrants from Kuwait by 1 or more Vehicles in Household
In terms of 1 or more vehicles in household, the demographic groups most similar to Immigrants from Kuwait are Armenian (90.7%, a difference of 0.020%), Serbian (90.7%, a difference of 0.030%), Chippewa (90.7%, a difference of 0.030%), Immigrants from Netherlands (90.8%, a difference of 0.080%), and Navajo (90.8%, a difference of 0.090%).
| Demographics | Rating | Rank | 1 or more Vehicles in Household |
| Zimbabweans | 97.7 /100 | #106 | Exceptional 91.0% |
| Maltese | 97.7 /100 | #107 | Exceptional 91.0% |
| Hispanics or Latinos | 97.6 /100 | #108 | Exceptional 91.0% |
| Delaware | 97.6 /100 | #109 | Exceptional 91.0% |
| Mexican American Indians | 97.4 /100 | #110 | Exceptional 91.0% |
| Navajo | 95.8 /100 | #111 | Exceptional 90.8% |
| Immigrants | Netherlands | 95.7 /100 | #112 | Exceptional 90.8% |
| Immigrants | Kuwait | 94.7 /100 | #113 | Exceptional 90.7% |
| Armenians | 94.5 /100 | #114 | Exceptional 90.7% |
| Serbians | 94.3 /100 | #115 | Exceptional 90.7% |
| Chippewa | 94.3 /100 | #116 | Exceptional 90.7% |
| Greeks | 93.5 /100 | #117 | Exceptional 90.6% |
| Japanese | 93.4 /100 | #118 | Exceptional 90.6% |
| Blackfeet | 92.6 /100 | #119 | Exceptional 90.6% |
| Immigrants | Thailand | 92.3 /100 | #120 | Exceptional 90.6% |