Croatian vs British 1 or more Vehicles in Household
COMPARE
Croatian
British
1 or more Vehicles in Household
1 or more Vehicles in Household Comparison
Croatians
British
91.9%
1 OR MORE VEHICLES IN HOUSEHOLD
99.8/ 100
METRIC RATING
64th/ 347
METRIC RANK
92.5%
1 OR MORE VEHICLES IN HOUSEHOLD
100.0/ 100
METRIC RATING
26th/ 347
METRIC RANK
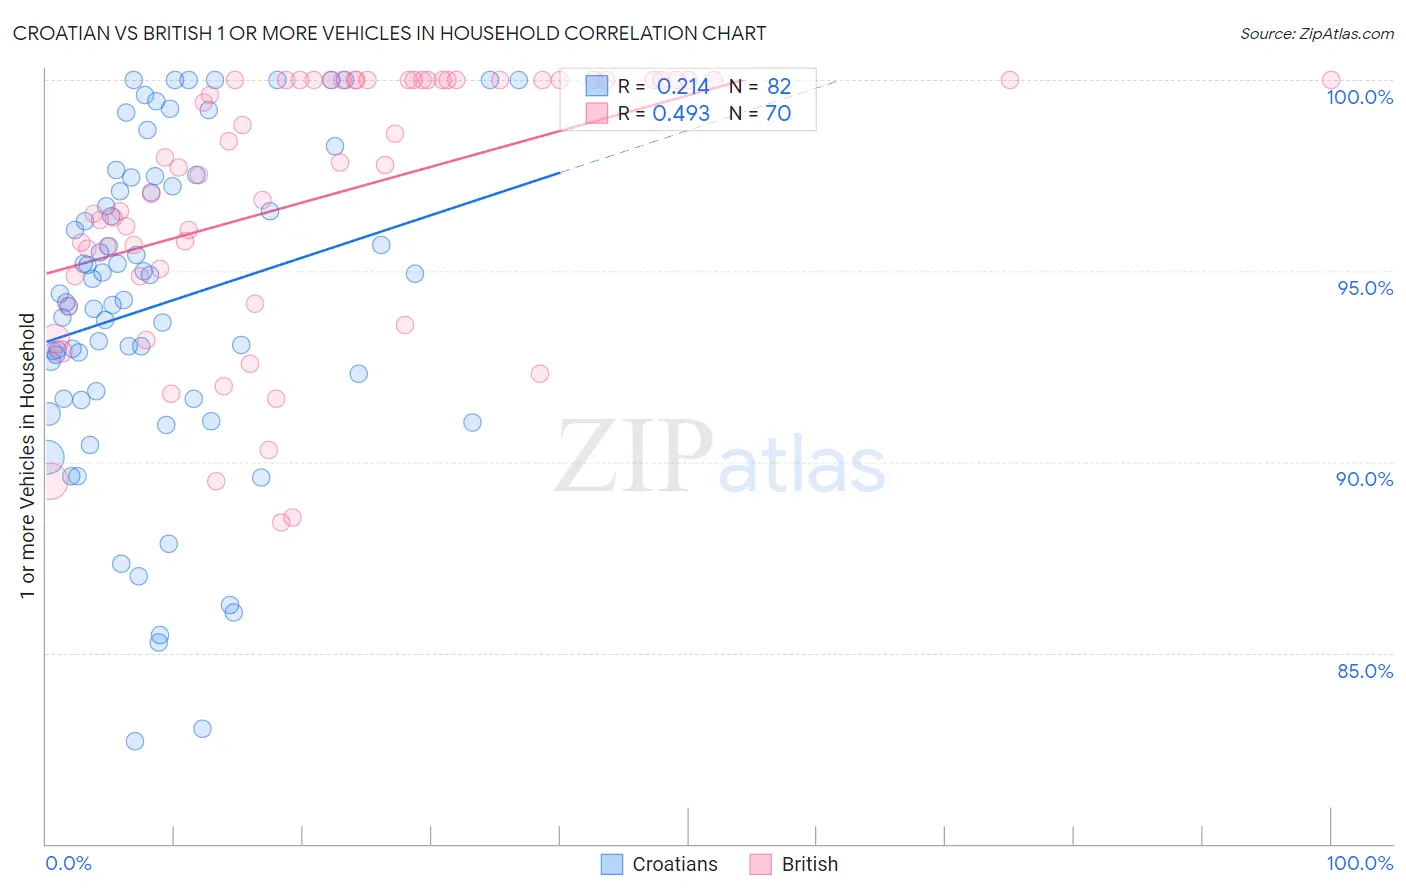
Croatian vs British 1 or more Vehicles in Household Correlation Chart
The statistical analysis conducted on geographies consisting of 375,584,731 people shows a weak positive correlation between the proportion of Croatians and percentage of households with 1 or more vehicles available in the United States with a correlation coefficient (R) of 0.214 and weighted average of 91.9%. Similarly, the statistical analysis conducted on geographies consisting of 531,095,342 people shows a moderate positive correlation between the proportion of British and percentage of households with 1 or more vehicles available in the United States with a correlation coefficient (R) of 0.493 and weighted average of 92.5%, a difference of 0.74%.
1 or more Vehicles in Household Correlation Summary
| Measurement | Croatian | British |
| Minimum | 82.7% | 88.4% |
| Maximum | 100.0% | 100.0% |
| Range | 17.3% | 11.6% |
| Mean | 94.1% | 96.9% |
| Median | 94.3% | 97.8% |
| Interquartile 25% (IQ1) | 91.7% | 94.9% |
| Interquartile 75% (IQ3) | 97.2% | 100.0% |
| Interquartile Range (IQR) | 5.5% | 5.1% |
| Standard Deviation (Sample) | 4.2% | 3.4% |
| Standard Deviation (Population) | 4.2% | 3.4% |
Similar Demographics by 1 or more Vehicles in Household
Demographics Similar to Croatians by 1 or more Vehicles in Household
In terms of 1 or more vehicles in household, the demographic groups most similar to Croatians are Chinese (91.9%, a difference of 0.010%), Immigrants from India (91.9%, a difference of 0.030%), Thai (91.9%, a difference of 0.030%), Immigrants from Laos (91.8%, a difference of 0.030%), and Slovak (91.9%, a difference of 0.050%).
| Demographics | Rating | Rank | 1 or more Vehicles in Household |
| Iraqis | 99.8 /100 | #57 | Exceptional 91.9% |
| Immigrants | Mexico | 99.8 /100 | #58 | Exceptional 91.9% |
| Venezuelans | 99.8 /100 | #59 | Exceptional 91.9% |
| Slovaks | 99.8 /100 | #60 | Exceptional 91.9% |
| Immigrants | India | 99.8 /100 | #61 | Exceptional 91.9% |
| Thais | 99.8 /100 | #62 | Exceptional 91.9% |
| Chinese | 99.8 /100 | #63 | Exceptional 91.9% |
| Croatians | 99.8 /100 | #64 | Exceptional 91.9% |
| Immigrants | Laos | 99.8 /100 | #65 | Exceptional 91.8% |
| Canadians | 99.8 /100 | #66 | Exceptional 91.8% |
| Spaniards | 99.8 /100 | #67 | Exceptional 91.8% |
| Immigrants | Scotland | 99.7 /100 | #68 | Exceptional 91.8% |
| Palestinians | 99.7 /100 | #69 | Exceptional 91.7% |
| Lithuanians | 99.7 /100 | #70 | Exceptional 91.7% |
| Poles | 99.7 /100 | #71 | Exceptional 91.7% |
Demographics Similar to British by 1 or more Vehicles in Household
In terms of 1 or more vehicles in household, the demographic groups most similar to British are Immigrants from Iraq (92.5%, a difference of 0.020%), Yaqui (92.6%, a difference of 0.040%), American (92.5%, a difference of 0.050%), Sri Lankan (92.5%, a difference of 0.080%), and Native Hawaiian (92.4%, a difference of 0.090%).
| Demographics | Rating | Rank | 1 or more Vehicles in Household |
| Tongans | 100.0 /100 | #19 | Exceptional 92.9% |
| Arapaho | 100.0 /100 | #20 | Exceptional 92.7% |
| Ottawa | 100.0 /100 | #21 | Exceptional 92.7% |
| French | 100.0 /100 | #22 | Exceptional 92.7% |
| Nepalese | 100.0 /100 | #23 | Exceptional 92.6% |
| Yaqui | 100.0 /100 | #24 | Exceptional 92.6% |
| Immigrants | Iraq | 100.0 /100 | #25 | Exceptional 92.5% |
| British | 100.0 /100 | #26 | Exceptional 92.5% |
| Americans | 100.0 /100 | #27 | Exceptional 92.5% |
| Sri Lankans | 100.0 /100 | #28 | Exceptional 92.5% |
| Native Hawaiians | 100.0 /100 | #29 | Exceptional 92.4% |
| Finns | 100.0 /100 | #30 | Exceptional 92.4% |
| Samoans | 100.0 /100 | #31 | Exceptional 92.4% |
| Basques | 100.0 /100 | #32 | Exceptional 92.4% |
| Cherokee | 100.0 /100 | #33 | Exceptional 92.4% |