Cree vs Nigerian Householder Income Ages 45 - 64 years
COMPARE
Cree
Nigerian
Householder Income Ages 45 - 64 years
Householder Income Ages 45 - 64 years Comparison
Cree
Nigerians
$87,185
HOUSEHOLDER INCOME AGES 45 - 64 YEARS
0.1/ 100
METRIC RATING
277th/ 347
METRIC RANK
$95,492
HOUSEHOLDER INCOME AGES 45 - 64 YEARS
8.2/ 100
METRIC RATING
215th/ 347
METRIC RANK
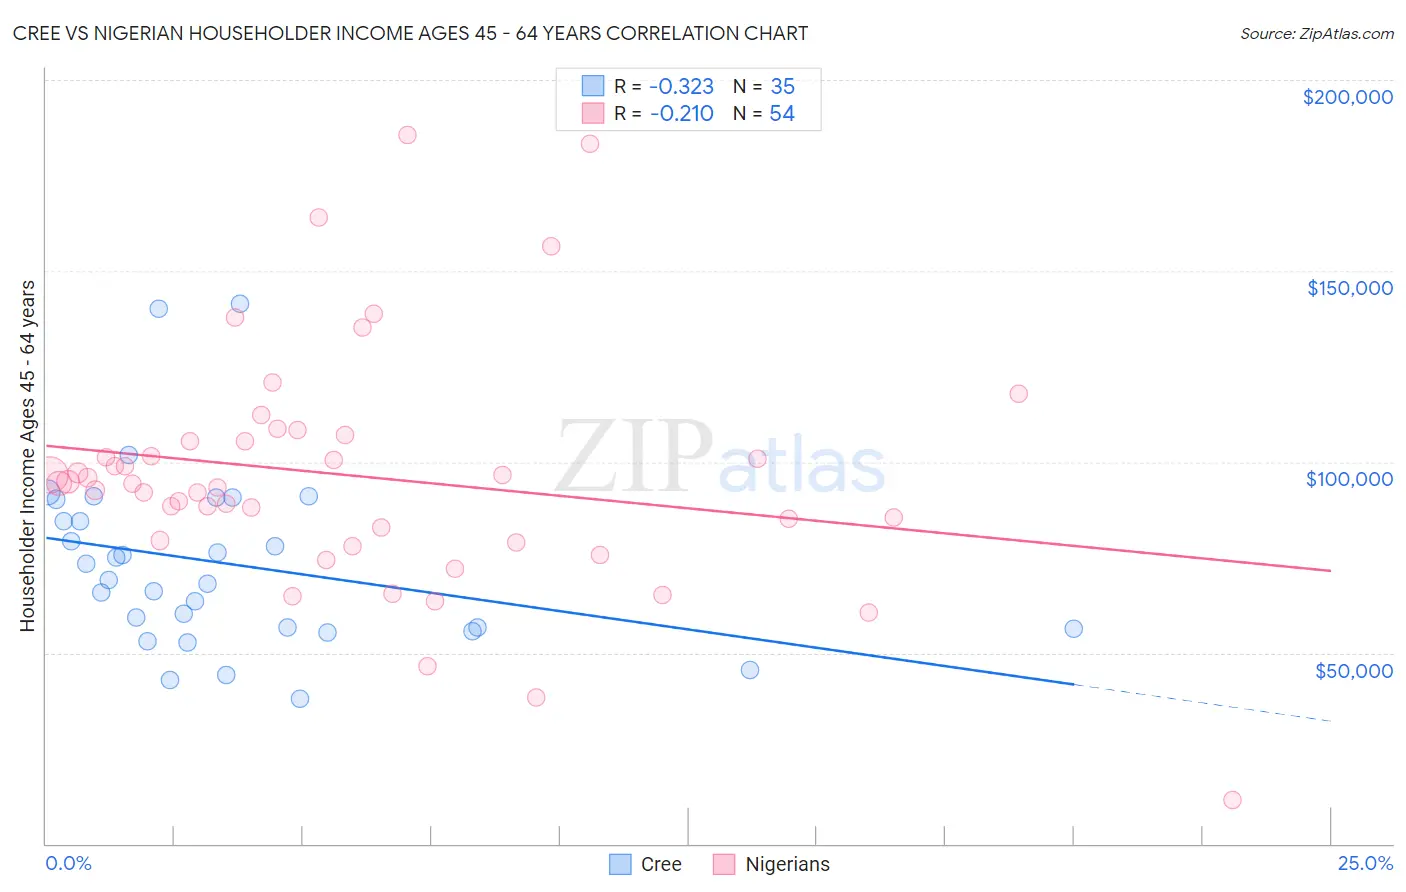
Cree vs Nigerian Householder Income Ages 45 - 64 years Correlation Chart
The statistical analysis conducted on geographies consisting of 76,173,826 people shows a mild negative correlation between the proportion of Cree and household income with householder between the ages 45 and 64 in the United States with a correlation coefficient (R) of -0.323 and weighted average of $87,185. Similarly, the statistical analysis conducted on geographies consisting of 332,111,540 people shows a weak negative correlation between the proportion of Nigerians and household income with householder between the ages 45 and 64 in the United States with a correlation coefficient (R) of -0.210 and weighted average of $95,492, a difference of 9.5%.
Householder Income Ages 45 - 64 years Correlation Summary
| Measurement | Cree | Nigerian |
| Minimum | $38,125 | $11,458 |
| Maximum | $141,447 | $185,761 |
| Range | $103,322 | $174,303 |
| Mean | $73,266 | $96,275 |
| Median | $69,060 | $94,283 |
| Interquartile 25% (IQ1) | $56,250 | $79,390 |
| Interquartile 75% (IQ3) | $90,223 | $105,427 |
| Interquartile Range (IQR) | $33,973 | $26,037 |
| Standard Deviation (Sample) | $23,520 | $31,417 |
| Standard Deviation (Population) | $23,182 | $31,125 |
Similar Demographics by Householder Income Ages 45 - 64 years
Demographics Similar to Cree by Householder Income Ages 45 - 64 years
In terms of householder income ages 45 - 64 years, the demographic groups most similar to Cree are Immigrants from Latin America ($87,219, a difference of 0.040%), Immigrants from Belize ($87,229, a difference of 0.050%), Iroquois ($87,255, a difference of 0.080%), Immigrants from Jamaica ($87,035, a difference of 0.17%), and Yakama ($86,992, a difference of 0.22%).
| Demographics | Rating | Rank | Householder Income Ages 45 - 64 years |
| Immigrants | Liberia | 0.2 /100 | #270 | Tragic $87,739 |
| Guatemalans | 0.2 /100 | #271 | Tragic $87,705 |
| Cape Verdeans | 0.2 /100 | #272 | Tragic $87,580 |
| Spanish American Indians | 0.2 /100 | #273 | Tragic $87,561 |
| Iroquois | 0.1 /100 | #274 | Tragic $87,255 |
| Immigrants | Belize | 0.1 /100 | #275 | Tragic $87,229 |
| Immigrants | Latin America | 0.1 /100 | #276 | Tragic $87,219 |
| Cree | 0.1 /100 | #277 | Tragic $87,185 |
| Immigrants | Jamaica | 0.1 /100 | #278 | Tragic $87,035 |
| Yakama | 0.1 /100 | #279 | Tragic $86,992 |
| Immigrants | Somalia | 0.1 /100 | #280 | Tragic $86,987 |
| Yaqui | 0.1 /100 | #281 | Tragic $86,914 |
| Senegalese | 0.1 /100 | #282 | Tragic $86,897 |
| Mexicans | 0.1 /100 | #283 | Tragic $86,816 |
| Central American Indians | 0.1 /100 | #284 | Tragic $86,764 |
Demographics Similar to Nigerians by Householder Income Ages 45 - 64 years
In terms of householder income ages 45 - 64 years, the demographic groups most similar to Nigerians are Immigrants from Venezuela ($95,342, a difference of 0.16%), Immigrants from Ghana ($94,982, a difference of 0.54%), Panamanian ($96,066, a difference of 0.60%), Delaware ($94,914, a difference of 0.61%), and Immigrants from Uruguay ($96,086, a difference of 0.62%).
| Demographics | Rating | Rank | Householder Income Ages 45 - 64 years |
| Scotch-Irish | 16.4 /100 | #208 | Poor $97,073 |
| Japanese | 14.8 /100 | #209 | Poor $96,834 |
| Tsimshian | 14.5 /100 | #210 | Poor $96,783 |
| Immigrants | Cambodia | 13.0 /100 | #211 | Poor $96,537 |
| Venezuelans | 12.6 /100 | #212 | Poor $96,460 |
| Immigrants | Uruguay | 10.7 /100 | #213 | Poor $96,086 |
| Panamanians | 10.6 /100 | #214 | Poor $96,066 |
| Nigerians | 8.2 /100 | #215 | Tragic $95,492 |
| Immigrants | Venezuela | 7.6 /100 | #216 | Tragic $95,342 |
| Immigrants | Ghana | 6.4 /100 | #217 | Tragic $94,982 |
| Delaware | 6.2 /100 | #218 | Tragic $94,914 |
| Immigrants | Armenia | 6.1 /100 | #219 | Tragic $94,863 |
| Salvadorans | 6.0 /100 | #220 | Tragic $94,842 |
| Immigrants | Nigeria | 5.9 /100 | #221 | Tragic $94,804 |
| Malaysians | 5.2 /100 | #222 | Tragic $94,517 |