Cree vs Puget Sound Salish 1 or more Vehicles in Household
COMPARE
Cree
Puget Sound Salish
1 or more Vehicles in Household
1 or more Vehicles in Household Comparison
Cree
Puget Sound Salish
88.7%
1 OR MORE VEHICLES IN HOUSEHOLD
6.0/ 100
METRIC RATING
225th/ 347
METRIC RANK
90.5%
1 OR MORE VEHICLES IN HOUSEHOLD
91.5/ 100
METRIC RATING
124th/ 347
METRIC RANK
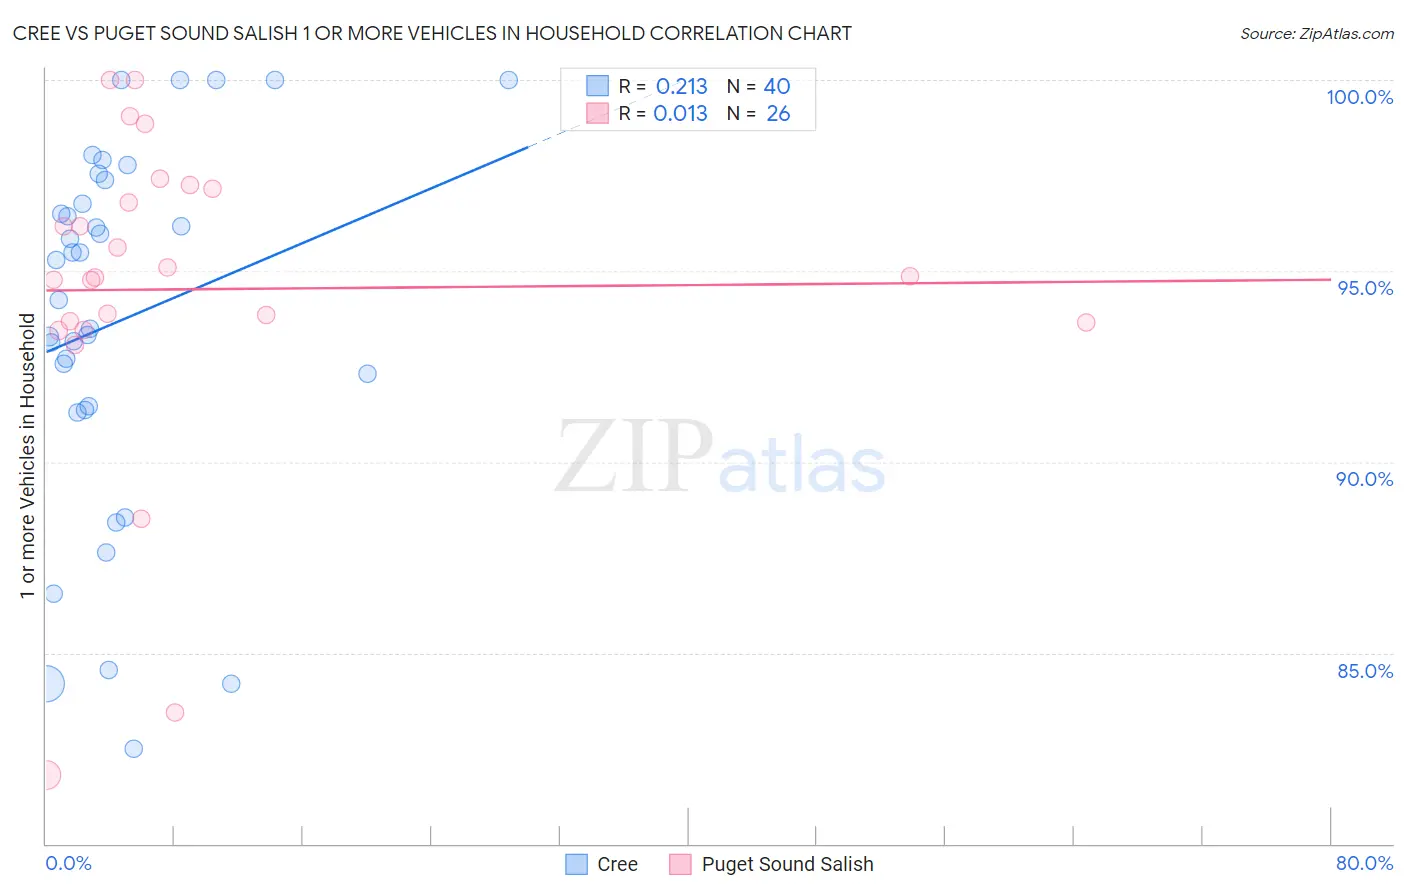
Cree vs Puget Sound Salish 1 or more Vehicles in Household Correlation Chart
The statistical analysis conducted on geographies consisting of 76,210,304 people shows a weak positive correlation between the proportion of Cree and percentage of households with 1 or more vehicles available in the United States with a correlation coefficient (R) of 0.213 and weighted average of 88.7%. Similarly, the statistical analysis conducted on geographies consisting of 46,155,865 people shows no correlation between the proportion of Puget Sound Salish and percentage of households with 1 or more vehicles available in the United States with a correlation coefficient (R) of 0.013 and weighted average of 90.5%, a difference of 2.0%.
1 or more Vehicles in Household Correlation Summary
| Measurement | Cree | Puget Sound Salish |
| Minimum | 82.5% | 81.8% |
| Maximum | 100.0% | 100.0% |
| Range | 17.5% | 18.2% |
| Mean | 93.7% | 94.5% |
| Median | 94.8% | 94.8% |
| Interquartile 25% (IQ1) | 91.4% | 93.7% |
| Interquartile 75% (IQ3) | 97.1% | 97.2% |
| Interquartile Range (IQR) | 5.7% | 3.5% |
| Standard Deviation (Sample) | 4.8% | 4.3% |
| Standard Deviation (Population) | 4.7% | 4.2% |
Similar Demographics by 1 or more Vehicles in Household
Demographics Similar to Cree by 1 or more Vehicles in Household
In terms of 1 or more vehicles in household, the demographic groups most similar to Cree are Immigrants from Hong Kong (88.7%, a difference of 0.010%), Cheyenne (88.7%, a difference of 0.030%), Ute (88.7%, a difference of 0.030%), Immigrants from Norway (88.7%, a difference of 0.040%), and Immigrants from Romania (88.7%, a difference of 0.050%).
| Demographics | Rating | Rank | 1 or more Vehicles in Household |
| Ugandans | 8.7 /100 | #218 | Tragic 88.9% |
| Immigrants | Guatemala | 8.6 /100 | #219 | Tragic 88.9% |
| Immigrants | Zaire | 8.1 /100 | #220 | Tragic 88.8% |
| Peruvians | 7.9 /100 | #221 | Tragic 88.8% |
| Uruguayans | 7.0 /100 | #222 | Tragic 88.8% |
| Immigrants | South America | 7.0 /100 | #223 | Tragic 88.8% |
| Immigrants | Hong Kong | 6.2 /100 | #224 | Tragic 88.7% |
| Cree | 6.0 /100 | #225 | Tragic 88.7% |
| Cheyenne | 5.7 /100 | #226 | Tragic 88.7% |
| Ute | 5.6 /100 | #227 | Tragic 88.7% |
| Immigrants | Norway | 5.5 /100 | #228 | Tragic 88.7% |
| Immigrants | Romania | 5.4 /100 | #229 | Tragic 88.7% |
| Immigrants | Sierra Leone | 5.2 /100 | #230 | Tragic 88.7% |
| Russians | 5.0 /100 | #231 | Tragic 88.7% |
| Immigrants | Japan | 4.9 /100 | #232 | Tragic 88.7% |
Demographics Similar to Puget Sound Salish by 1 or more Vehicles in Household
In terms of 1 or more vehicles in household, the demographic groups most similar to Puget Sound Salish are Costa Rican (90.5%, a difference of 0.020%), Fijian (90.5%, a difference of 0.020%), Icelander (90.5%, a difference of 0.030%), Immigrants from Thailand (90.6%, a difference of 0.040%), and Immigrants from Korea (90.5%, a difference of 0.040%).
| Demographics | Rating | Rank | 1 or more Vehicles in Household |
| Greeks | 93.5 /100 | #117 | Exceptional 90.6% |
| Japanese | 93.4 /100 | #118 | Exceptional 90.6% |
| Blackfeet | 92.6 /100 | #119 | Exceptional 90.6% |
| Immigrants | Thailand | 92.3 /100 | #120 | Exceptional 90.6% |
| Icelanders | 92.1 /100 | #121 | Exceptional 90.5% |
| Costa Ricans | 92.0 /100 | #122 | Exceptional 90.5% |
| Fijians | 91.8 /100 | #123 | Exceptional 90.5% |
| Puget Sound Salish | 91.5 /100 | #124 | Exceptional 90.5% |
| Immigrants | Korea | 90.5 /100 | #125 | Exceptional 90.5% |
| Immigrants | Cameroon | 89.4 /100 | #126 | Excellent 90.4% |
| Immigrants | Azores | 89.1 /100 | #127 | Excellent 90.4% |
| Burmese | 89.0 /100 | #128 | Excellent 90.4% |
| Marshallese | 88.9 /100 | #129 | Excellent 90.4% |
| Nicaraguans | 88.8 /100 | #130 | Excellent 90.4% |
| Immigrants | Kenya | 88.5 /100 | #131 | Excellent 90.4% |