Mexican American Indian vs Immigrants from Bangladesh 2 or more Vehicles in Household
COMPARE
Mexican American Indian
Immigrants from Bangladesh
2 or more Vehicles in Household
2 or more Vehicles in Household Comparison
Mexican American Indians
Immigrants from Bangladesh
58.7%
2 OR MORE VEHICLES IN HOUSEHOLD
99.8/ 100
METRIC RATING
63rd/ 347
METRIC RANK
38.8%
2 OR MORE VEHICLES IN HOUSEHOLD
0.0/ 100
METRIC RATING
335th/ 347
METRIC RANK
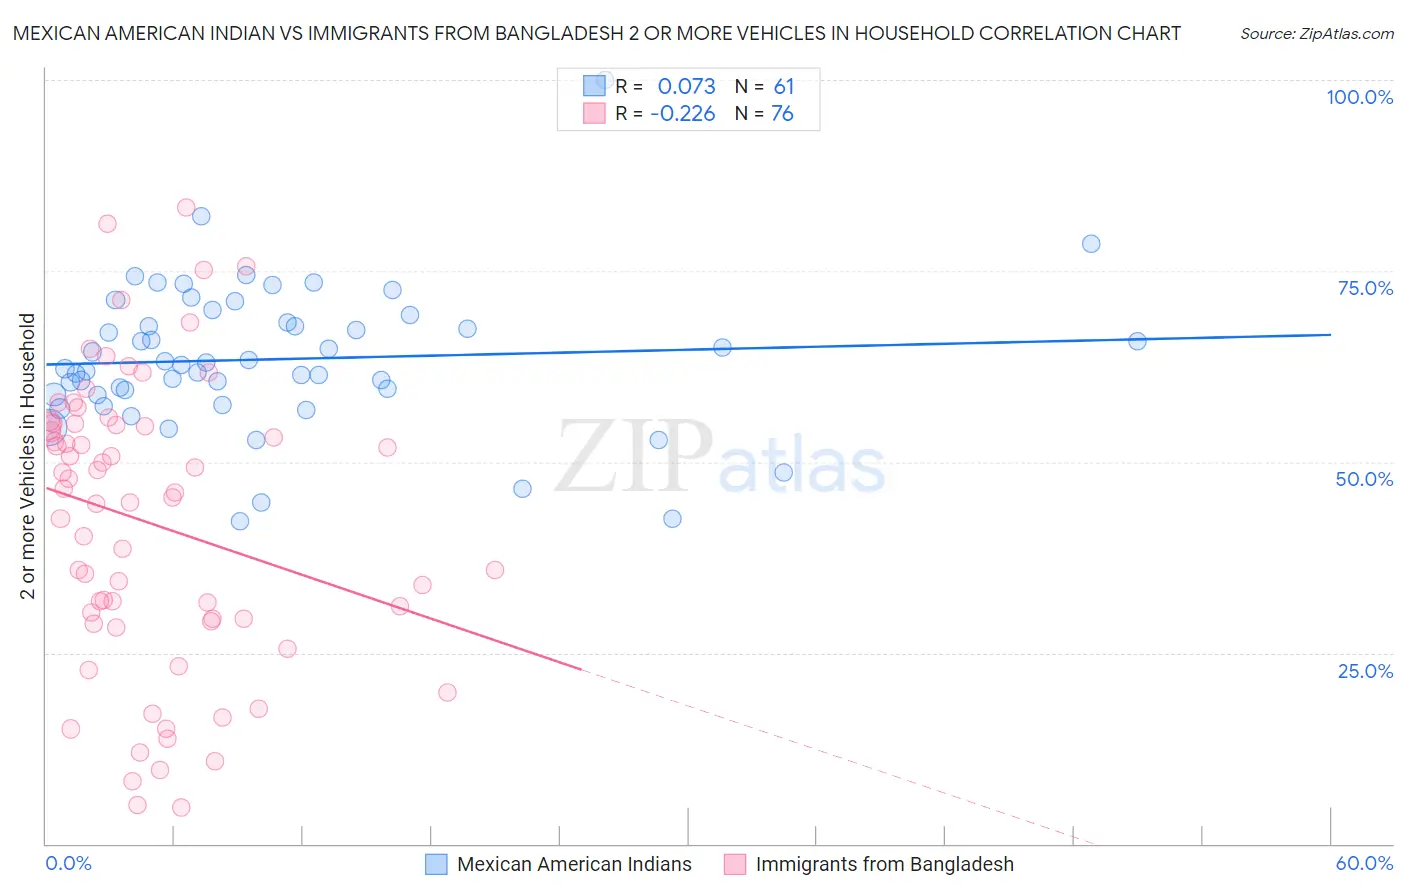
Mexican American Indian vs Immigrants from Bangladesh 2 or more Vehicles in Household Correlation Chart
The statistical analysis conducted on geographies consisting of 317,508,638 people shows a slight positive correlation between the proportion of Mexican American Indians and percentage of households with 2 or more vehicles available in the United States with a correlation coefficient (R) of 0.073 and weighted average of 58.7%. Similarly, the statistical analysis conducted on geographies consisting of 203,599,263 people shows a weak negative correlation between the proportion of Immigrants from Bangladesh and percentage of households with 2 or more vehicles available in the United States with a correlation coefficient (R) of -0.226 and weighted average of 38.8%, a difference of 51.4%.
2 or more Vehicles in Household Correlation Summary
| Measurement | Mexican American Indian | Immigrants from Bangladesh |
| Minimum | 42.3% | 4.7% |
| Maximum | 100.0% | 83.3% |
| Range | 57.7% | 78.7% |
| Mean | 63.5% | 42.0% |
| Median | 62.7% | 45.6% |
| Interquartile 25% (IQ1) | 58.8% | 29.2% |
| Interquartile 75% (IQ3) | 68.8% | 54.9% |
| Interquartile Range (IQR) | 10.0% | 25.7% |
| Standard Deviation (Sample) | 9.6% | 18.9% |
| Standard Deviation (Population) | 9.5% | 18.8% |
Similar Demographics by 2 or more Vehicles in Household
Demographics Similar to Mexican American Indians by 2 or more Vehicles in Household
In terms of 2 or more vehicles in household, the demographic groups most similar to Mexican American Indians are Nonimmigrants (58.8%, a difference of 0.070%), Osage (58.8%, a difference of 0.11%), Portuguese (58.6%, a difference of 0.16%), Immigrants from Central America (58.6%, a difference of 0.21%), and Croatian (58.6%, a difference of 0.21%).
| Demographics | Rating | Rank | 2 or more Vehicles in Household |
| Chickasaw | 99.9 /100 | #56 | Exceptional 59.0% |
| Afghans | 99.9 /100 | #57 | Exceptional 59.0% |
| Immigrants | Scotland | 99.8 /100 | #58 | Exceptional 58.9% |
| Spanish Americans | 99.8 /100 | #59 | Exceptional 58.9% |
| French Canadians | 99.8 /100 | #60 | Exceptional 58.9% |
| Osage | 99.8 /100 | #61 | Exceptional 58.8% |
| Immigrants | Nonimmigrants | 99.8 /100 | #62 | Exceptional 58.8% |
| Mexican American Indians | 99.8 /100 | #63 | Exceptional 58.7% |
| Portuguese | 99.7 /100 | #64 | Exceptional 58.6% |
| Immigrants | Central America | 99.7 /100 | #65 | Exceptional 58.6% |
| Croatians | 99.7 /100 | #66 | Exceptional 58.6% |
| Laotians | 99.7 /100 | #67 | Exceptional 58.6% |
| Canadians | 99.7 /100 | #68 | Exceptional 58.6% |
| Pennsylvania Germans | 99.7 /100 | #69 | Exceptional 58.5% |
| Italians | 99.6 /100 | #70 | Exceptional 58.4% |
Demographics Similar to Immigrants from Bangladesh by 2 or more Vehicles in Household
In terms of 2 or more vehicles in household, the demographic groups most similar to Immigrants from Bangladesh are Vietnamese (38.5%, a difference of 0.72%), Barbadian (38.3%, a difference of 1.1%), Immigrants from Uzbekistan (37.9%, a difference of 2.3%), Immigrants from Trinidad and Tobago (40.3%, a difference of 3.9%), and Immigrants from Ecuador (40.5%, a difference of 4.5%).
| Demographics | Rating | Rank | 2 or more Vehicles in Household |
| Inupiat | 0.0 /100 | #328 | Tragic 42.6% |
| Ecuadorians | 0.0 /100 | #329 | Tragic 42.0% |
| Immigrants | Dominica | 0.0 /100 | #330 | Tragic 41.6% |
| West Indians | 0.0 /100 | #331 | Tragic 41.3% |
| Trinidadians and Tobagonians | 0.0 /100 | #332 | Tragic 40.9% |
| Immigrants | Ecuador | 0.0 /100 | #333 | Tragic 40.5% |
| Immigrants | Trinidad and Tobago | 0.0 /100 | #334 | Tragic 40.3% |
| Immigrants | Bangladesh | 0.0 /100 | #335 | Tragic 38.8% |
| Vietnamese | 0.0 /100 | #336 | Tragic 38.5% |
| Barbadians | 0.0 /100 | #337 | Tragic 38.3% |
| Immigrants | Uzbekistan | 0.0 /100 | #338 | Tragic 37.9% |
| Immigrants | Barbados | 0.0 /100 | #339 | Tragic 35.8% |
| British West Indians | 0.0 /100 | #340 | Tragic 35.4% |
| Guyanese | 0.0 /100 | #341 | Tragic 35.4% |
| Dominicans | 0.0 /100 | #342 | Tragic 35.3% |