Chinese vs Bangladeshi 4 or more Vehicles in Household
COMPARE
Chinese
Bangladeshi
4 or more Vehicles in Household
4 or more Vehicles in Household Comparison
Chinese
Bangladeshis
8.8%
4 OR MORE VEHICLES IN HOUSEHOLD
100.0/ 100
METRIC RATING
14th/ 347
METRIC RANK
7.6%
4 OR MORE VEHICLES IN HOUSEHOLD
100.0/ 100
METRIC RATING
64th/ 347
METRIC RANK
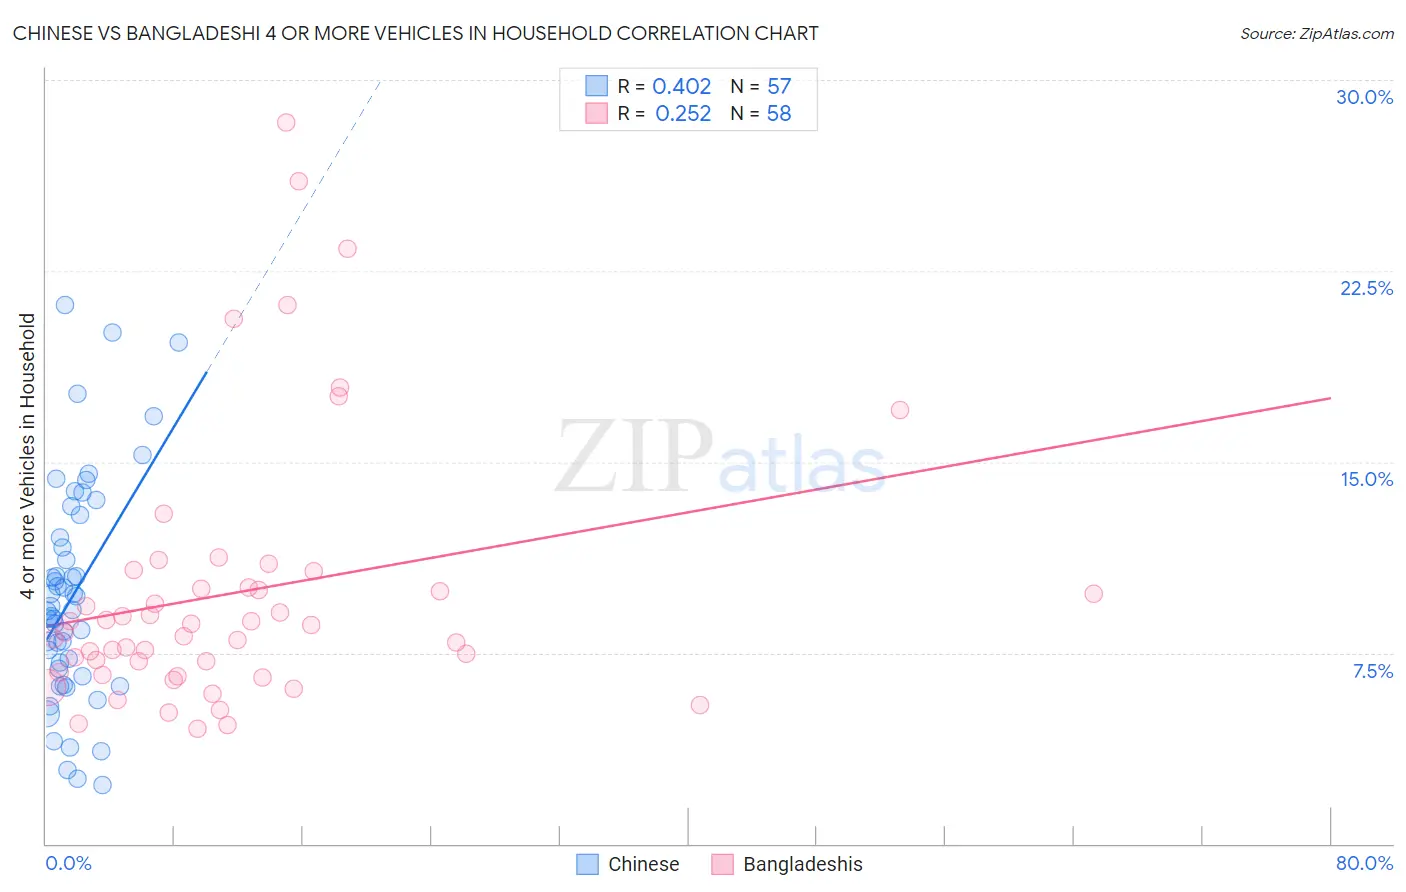
Chinese vs Bangladeshi 4 or more Vehicles in Household Correlation Chart
The statistical analysis conducted on geographies consisting of 64,794,143 people shows a moderate positive correlation between the proportion of Chinese and percentage of households with 4 or more vehicles available in the United States with a correlation coefficient (R) of 0.402 and weighted average of 8.8%. Similarly, the statistical analysis conducted on geographies consisting of 141,012,944 people shows a weak positive correlation between the proportion of Bangladeshis and percentage of households with 4 or more vehicles available in the United States with a correlation coefficient (R) of 0.252 and weighted average of 7.6%, a difference of 17.2%.
4 or more Vehicles in Household Correlation Summary
| Measurement | Chinese | Bangladeshi |
| Minimum | 2.3% | 4.5% |
| Maximum | 21.2% | 28.3% |
| Range | 18.9% | 23.8% |
| Mean | 9.8% | 9.9% |
| Median | 9.2% | 8.5% |
| Interquartile 25% (IQ1) | 6.7% | 6.7% |
| Interquartile 75% (IQ3) | 12.5% | 10.1% |
| Interquartile Range (IQR) | 5.8% | 3.3% |
| Standard Deviation (Sample) | 4.3% | 5.2% |
| Standard Deviation (Population) | 4.3% | 5.2% |
Similar Demographics by 4 or more Vehicles in Household
Demographics Similar to Chinese by 4 or more Vehicles in Household
In terms of 4 or more vehicles in household, the demographic groups most similar to Chinese are Shoshone (8.8%, a difference of 0.030%), Lumbee (8.8%, a difference of 0.74%), Hawaiian (8.9%, a difference of 1.0%), Mexican (8.9%, a difference of 1.0%), and Ute (8.8%, a difference of 1.1%).
| Demographics | Rating | Rank | 4 or more Vehicles in Household |
| Native Hawaiians | 100.0 /100 | #7 | Exceptional 9.4% |
| Arapaho | 100.0 /100 | #8 | Exceptional 9.4% |
| Samoans | 100.0 /100 | #9 | Exceptional 9.2% |
| Paiute | 100.0 /100 | #10 | Exceptional 9.0% |
| Immigrants | Mexico | 100.0 /100 | #11 | Exceptional 9.0% |
| Mexicans | 100.0 /100 | #12 | Exceptional 8.9% |
| Hawaiians | 100.0 /100 | #13 | Exceptional 8.9% |
| Chinese | 100.0 /100 | #14 | Exceptional 8.8% |
| Shoshone | 100.0 /100 | #15 | Exceptional 8.8% |
| Lumbee | 100.0 /100 | #16 | Exceptional 8.8% |
| Ute | 100.0 /100 | #17 | Exceptional 8.8% |
| Nepalese | 100.0 /100 | #18 | Exceptional 8.7% |
| Koreans | 100.0 /100 | #19 | Exceptional 8.6% |
| Pueblo | 100.0 /100 | #20 | Exceptional 8.6% |
| Danes | 100.0 /100 | #21 | Exceptional 8.6% |
Demographics Similar to Bangladeshis by 4 or more Vehicles in Household
In terms of 4 or more vehicles in household, the demographic groups most similar to Bangladeshis are Immigrants from the Azores (7.5%, a difference of 0.040%), Immigrants from Micronesia (7.6%, a difference of 0.24%), Chippewa (7.6%, a difference of 0.25%), Immigrants from Taiwan (7.5%, a difference of 0.37%), and American (7.5%, a difference of 0.38%).
| Demographics | Rating | Rank | 4 or more Vehicles in Household |
| Pennsylvania Germans | 100.0 /100 | #57 | Exceptional 7.6% |
| Swedes | 100.0 /100 | #58 | Exceptional 7.6% |
| Hispanics or Latinos | 100.0 /100 | #59 | Exceptional 7.6% |
| Spaniards | 100.0 /100 | #60 | Exceptional 7.6% |
| Europeans | 100.0 /100 | #61 | Exceptional 7.6% |
| Chippewa | 100.0 /100 | #62 | Exceptional 7.6% |
| Immigrants | Micronesia | 100.0 /100 | #63 | Exceptional 7.6% |
| Bangladeshis | 100.0 /100 | #64 | Exceptional 7.6% |
| Immigrants | Azores | 100.0 /100 | #65 | Exceptional 7.5% |
| Immigrants | Taiwan | 99.9 /100 | #66 | Exceptional 7.5% |
| Americans | 99.9 /100 | #67 | Exceptional 7.5% |
| Welsh | 99.9 /100 | #68 | Exceptional 7.5% |
| Germans | 99.9 /100 | #69 | Exceptional 7.5% |
| Scottish | 99.9 /100 | #70 | Exceptional 7.4% |
| Chickasaw | 99.9 /100 | #71 | Exceptional 7.4% |