Cajun vs South American Unemployment Among Women with Children Under 6 years
COMPARE
Cajun
South American
Unemployment Among Women with Children Under 6 years
Unemployment Among Women with Children Under 6 years Comparison
Cajuns
South Americans
9.2%
UNEMPLOYMENT AMONG WOMEN WITH CHILDREN UNDER 6 YEARS
0.0/ 100
METRIC RATING
310th/ 347
METRIC RANK
7.5%
UNEMPLOYMENT AMONG WOMEN WITH CHILDREN UNDER 6 YEARS
74.1/ 100
METRIC RATING
155th/ 347
METRIC RANK
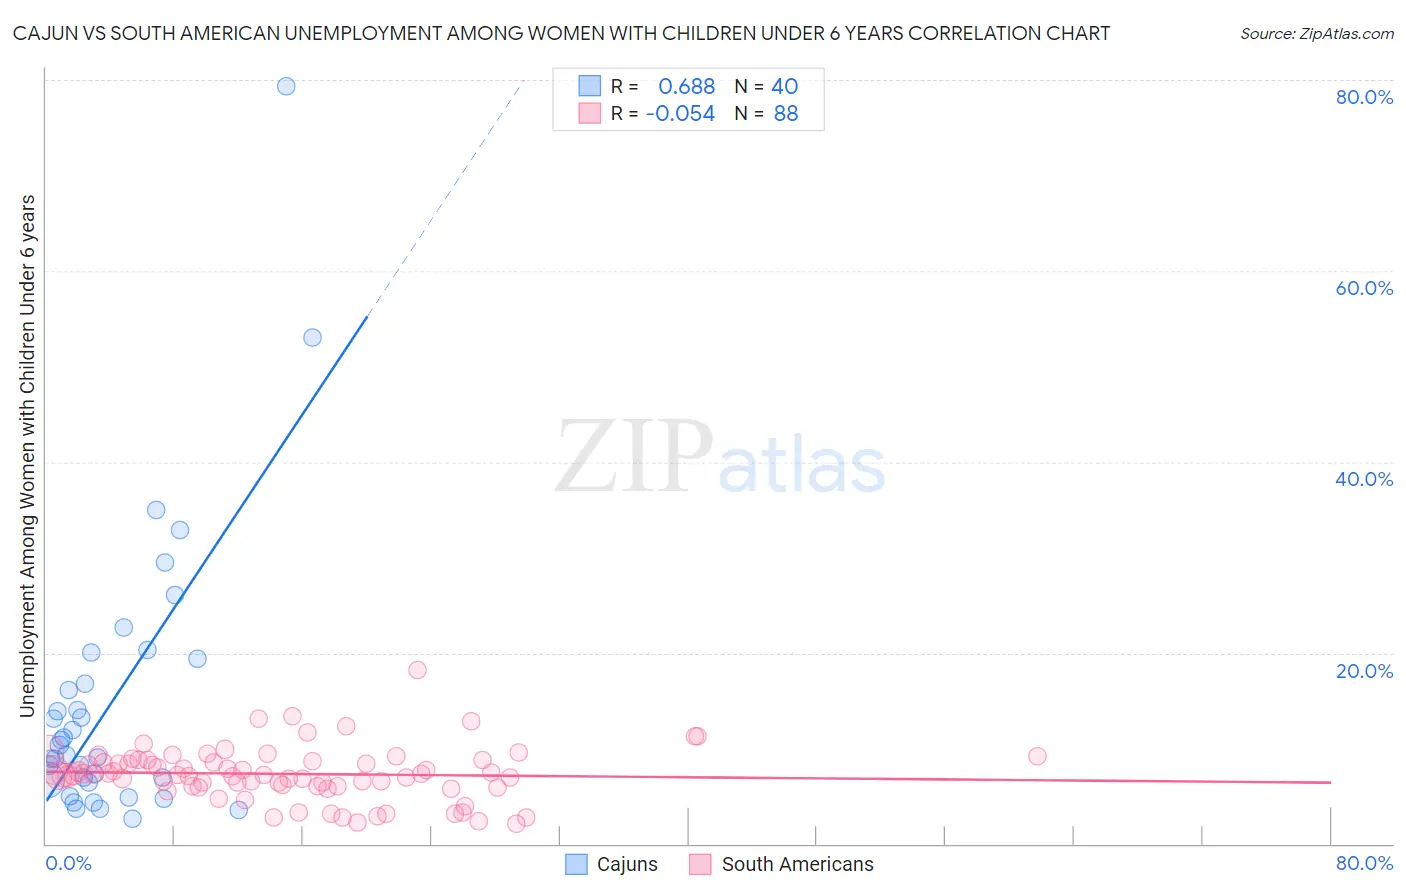
Cajun vs South American Unemployment Among Women with Children Under 6 years Correlation Chart
The statistical analysis conducted on geographies consisting of 126,859,508 people shows a significant positive correlation between the proportion of Cajuns and unemployment rate among women with children under the age of 6 in the United States with a correlation coefficient (R) of 0.688 and weighted average of 9.2%. Similarly, the statistical analysis conducted on geographies consisting of 355,844,194 people shows a slight negative correlation between the proportion of South Americans and unemployment rate among women with children under the age of 6 in the United States with a correlation coefficient (R) of -0.054 and weighted average of 7.5%, a difference of 22.1%.
Unemployment Among Women with Children Under 6 years Correlation Summary
| Measurement | Cajun | South American |
| Minimum | 2.6% | 2.1% |
| Maximum | 79.4% | 18.2% |
| Range | 76.8% | 16.1% |
| Mean | 14.8% | 7.3% |
| Median | 9.8% | 7.3% |
| Interquartile 25% (IQ1) | 6.5% | 6.0% |
| Interquartile 75% (IQ3) | 18.1% | 8.7% |
| Interquartile Range (IQR) | 11.5% | 2.6% |
| Standard Deviation (Sample) | 14.7% | 2.8% |
| Standard Deviation (Population) | 14.6% | 2.7% |
Similar Demographics by Unemployment Among Women with Children Under 6 years
Demographics Similar to Cajuns by Unemployment Among Women with Children Under 6 years
In terms of unemployment among women with children under 6 years, the demographic groups most similar to Cajuns are African (9.2%, a difference of 0.13%), French American Indian (9.2%, a difference of 0.28%), Immigrants from the Azores (9.2%, a difference of 0.42%), Immigrants from Micronesia (9.1%, a difference of 0.53%), and Dominican (9.1%, a difference of 0.59%).
| Demographics | Rating | Rank | Unemployment Among Women with Children Under 6 years |
| Immigrants | West Indies | 0.0 /100 | #303 | Tragic 9.0% |
| Immigrants | Mexico | 0.0 /100 | #304 | Tragic 9.1% |
| Alaskan Athabascans | 0.0 /100 | #305 | Tragic 9.1% |
| Pueblo | 0.0 /100 | #306 | Tragic 9.1% |
| Dominicans | 0.0 /100 | #307 | Tragic 9.1% |
| Immigrants | Micronesia | 0.0 /100 | #308 | Tragic 9.1% |
| Africans | 0.0 /100 | #309 | Tragic 9.2% |
| Cajuns | 0.0 /100 | #310 | Tragic 9.2% |
| French American Indians | 0.0 /100 | #311 | Tragic 9.2% |
| Immigrants | Azores | 0.0 /100 | #312 | Tragic 9.2% |
| Americans | 0.0 /100 | #313 | Tragic 9.3% |
| Fijians | 0.0 /100 | #314 | Tragic 9.3% |
| Cherokee | 0.0 /100 | #315 | Tragic 9.3% |
| Houma | 0.0 /100 | #316 | Tragic 9.4% |
| Dutch West Indians | 0.0 /100 | #317 | Tragic 9.5% |
Demographics Similar to South Americans by Unemployment Among Women with Children Under 6 years
In terms of unemployment among women with children under 6 years, the demographic groups most similar to South Americans are Northern European (7.5%, a difference of 0.020%), Uruguayan (7.5%, a difference of 0.050%), Bangladeshi (7.5%, a difference of 0.060%), Immigrants from Peru (7.5%, a difference of 0.070%), and Immigrants from Southern Europe (7.5%, a difference of 0.080%).
| Demographics | Rating | Rank | Unemployment Among Women with Children Under 6 years |
| Immigrants | Brazil | 77.3 /100 | #148 | Good 7.5% |
| Colombians | 76.1 /100 | #149 | Good 7.5% |
| Aleuts | 76.0 /100 | #150 | Good 7.5% |
| Immigrants | Peru | 74.9 /100 | #151 | Good 7.5% |
| Bangladeshis | 74.8 /100 | #152 | Good 7.5% |
| Uruguayans | 74.7 /100 | #153 | Good 7.5% |
| Northern Europeans | 74.3 /100 | #154 | Good 7.5% |
| South Americans | 74.1 /100 | #155 | Good 7.5% |
| Immigrants | Southern Europe | 73.2 /100 | #156 | Good 7.5% |
| Peruvians | 72.3 /100 | #157 | Good 7.5% |
| Croatians | 71.9 /100 | #158 | Good 7.5% |
| Immigrants | Philippines | 71.3 /100 | #159 | Good 7.5% |
| Bolivians | 70.8 /100 | #160 | Good 7.5% |
| Immigrants | Western Asia | 70.2 /100 | #161 | Good 7.5% |
| Immigrants | Lithuania | 68.8 /100 | #162 | Good 7.5% |