Vietnamese vs Immigrants from Ireland 1 or more Vehicles in Household
COMPARE
Vietnamese
Immigrants from Ireland
1 or more Vehicles in Household
1 or more Vehicles in Household Comparison
Vietnamese
Immigrants from Ireland
73.8%
1 OR MORE VEHICLES IN HOUSEHOLD
0.0/ 100
METRIC RATING
336th/ 347
METRIC RANK
86.4%
1 OR MORE VEHICLES IN HOUSEHOLD
0.0/ 100
METRIC RATING
289th/ 347
METRIC RANK
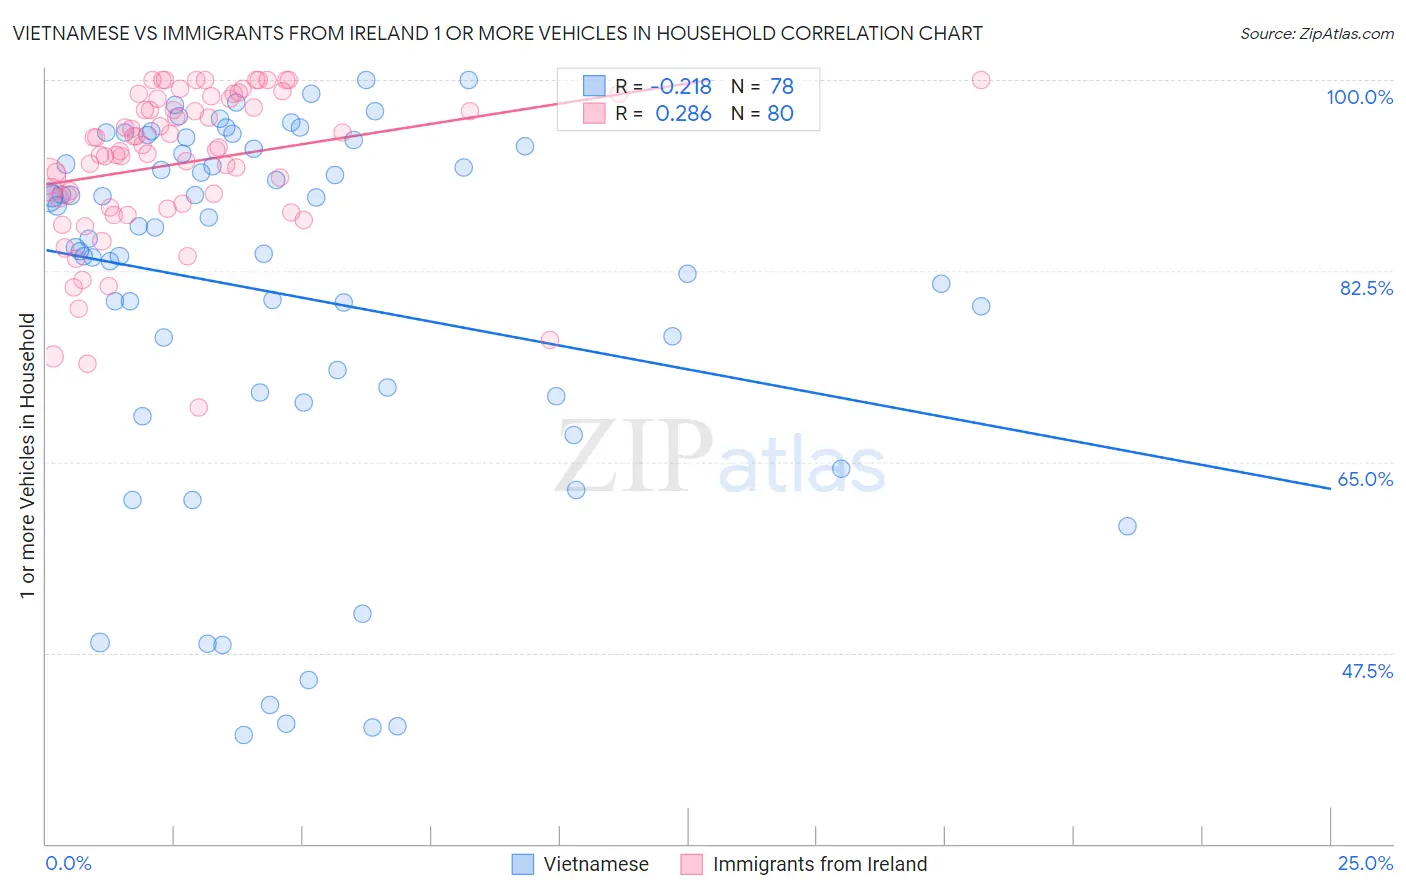
Vietnamese vs Immigrants from Ireland 1 or more Vehicles in Household Correlation Chart
The statistical analysis conducted on geographies consisting of 170,683,703 people shows a weak negative correlation between the proportion of Vietnamese and percentage of households with 1 or more vehicles available in the United States with a correlation coefficient (R) of -0.218 and weighted average of 73.8%. Similarly, the statistical analysis conducted on geographies consisting of 240,751,818 people shows a weak positive correlation between the proportion of Immigrants from Ireland and percentage of households with 1 or more vehicles available in the United States with a correlation coefficient (R) of 0.286 and weighted average of 86.4%, a difference of 17.0%.
1 or more Vehicles in Household Correlation Summary
| Measurement | Vietnamese | Immigrants from Ireland |
| Minimum | 39.9% | 70.0% |
| Maximum | 100.0% | 100.0% |
| Range | 60.1% | 30.0% |
| Mean | 80.4% | 92.4% |
| Median | 86.0% | 93.7% |
| Interquartile 25% (IQ1) | 71.3% | 88.5% |
| Interquartile 75% (IQ3) | 93.7% | 98.3% |
| Interquartile Range (IQR) | 22.4% | 9.8% |
| Standard Deviation (Sample) | 17.1% | 6.9% |
| Standard Deviation (Population) | 17.0% | 6.9% |
Similar Demographics by 1 or more Vehicles in Household
Demographics Similar to Vietnamese by 1 or more Vehicles in Household
In terms of 1 or more vehicles in household, the demographic groups most similar to Vietnamese are Barbadian (74.0%, a difference of 0.21%), Immigrants from Uzbekistan (73.4%, a difference of 0.62%), Immigrants from Bangladesh (74.3%, a difference of 0.65%), Inupiat (71.5%, a difference of 3.2%), and Immigrants from Ecuador (76.2%, a difference of 3.3%).
| Demographics | Rating | Rank | 1 or more Vehicles in Household |
| Immigrants | Dominica | 0.0 /100 | #329 | Tragic 77.8% |
| Immigrants | Trinidad and Tobago | 0.0 /100 | #330 | Tragic 76.8% |
| West Indians | 0.0 /100 | #331 | Tragic 76.4% |
| Trinidadians and Tobagonians | 0.0 /100 | #332 | Tragic 76.3% |
| Immigrants | Ecuador | 0.0 /100 | #333 | Tragic 76.2% |
| Immigrants | Bangladesh | 0.0 /100 | #334 | Tragic 74.3% |
| Barbadians | 0.0 /100 | #335 | Tragic 74.0% |
| Vietnamese | 0.0 /100 | #336 | Tragic 73.8% |
| Immigrants | Uzbekistan | 0.0 /100 | #337 | Tragic 73.4% |
| Inupiat | 0.0 /100 | #338 | Tragic 71.5% |
| Guyanese | 0.0 /100 | #339 | Tragic 70.8% |
| Dominicans | 0.0 /100 | #340 | Tragic 70.7% |
| Immigrants | Barbados | 0.0 /100 | #341 | Tragic 70.6% |
| Immigrants | Guyana | 0.0 /100 | #342 | Tragic 70.6% |
| British West Indians | 0.0 /100 | #343 | Tragic 70.4% |
Demographics Similar to Immigrants from Ireland by 1 or more Vehicles in Household
In terms of 1 or more vehicles in household, the demographic groups most similar to Immigrants from Ireland are Hopi (86.4%, a difference of 0.020%), Immigrants from Australia (86.4%, a difference of 0.040%), Immigrants from Malaysia (86.5%, a difference of 0.090%), Pima (86.3%, a difference of 0.12%), and Immigrants from Eastern Asia (86.5%, a difference of 0.16%).
| Demographics | Rating | Rank | 1 or more Vehicles in Household |
| Colville | 0.0 /100 | #282 | Tragic 86.8% |
| Immigrants | Eastern Europe | 0.0 /100 | #283 | Tragic 86.7% |
| Central American Indians | 0.0 /100 | #284 | Tragic 86.7% |
| Immigrants | Kazakhstan | 0.0 /100 | #285 | Tragic 86.6% |
| Immigrants | Eastern Asia | 0.0 /100 | #286 | Tragic 86.5% |
| Immigrants | Malaysia | 0.0 /100 | #287 | Tragic 86.5% |
| Hopi | 0.0 /100 | #288 | Tragic 86.4% |
| Immigrants | Ireland | 0.0 /100 | #289 | Tragic 86.4% |
| Immigrants | Australia | 0.0 /100 | #290 | Tragic 86.4% |
| Pima | 0.0 /100 | #291 | Tragic 86.3% |
| Okinawans | 0.0 /100 | #292 | Tragic 86.1% |
| Indians (Asian) | 0.0 /100 | #293 | Tragic 86.0% |
| Alaskan Athabascans | 0.0 /100 | #294 | Tragic 86.0% |
| Immigrants | Jamaica | 0.0 /100 | #295 | Tragic 85.8% |
| Immigrants | Spain | 0.0 /100 | #296 | Tragic 85.8% |