Bahamian vs Immigrants from Barbados 1 or more Vehicles in Household
COMPARE
Bahamian
Immigrants from Barbados
1 or more Vehicles in Household
1 or more Vehicles in Household Comparison
Bahamians
Immigrants from Barbados
90.2%
1 OR MORE VEHICLES IN HOUSEHOLD
80.5/ 100
METRIC RATING
146th/ 347
METRIC RANK
70.6%
1 OR MORE VEHICLES IN HOUSEHOLD
0.0/ 100
METRIC RATING
341st/ 347
METRIC RANK
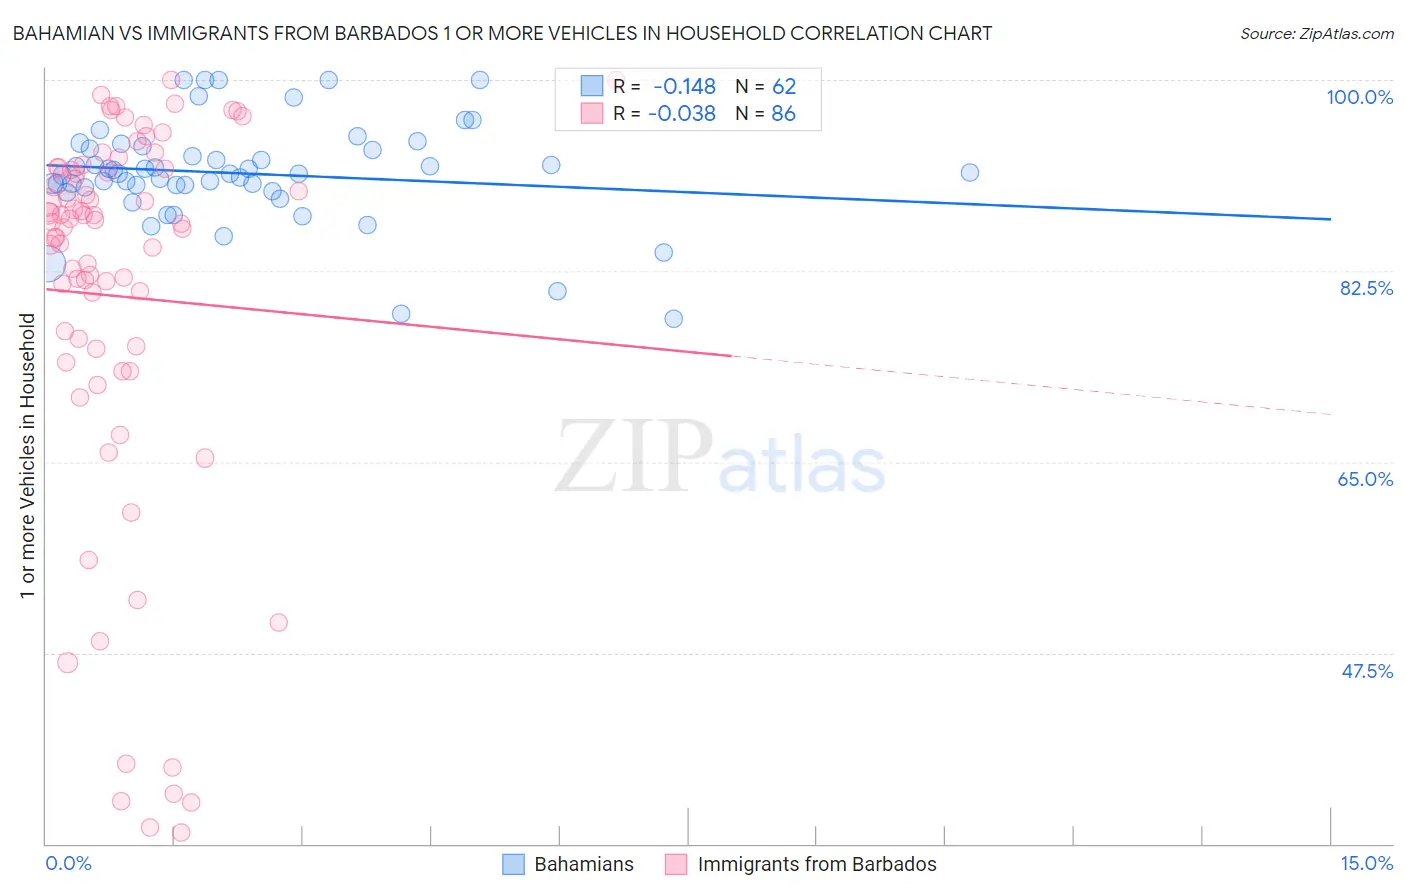
Bahamian vs Immigrants from Barbados 1 or more Vehicles in Household Correlation Chart
The statistical analysis conducted on geographies consisting of 112,631,692 people shows a poor negative correlation between the proportion of Bahamians and percentage of households with 1 or more vehicles available in the United States with a correlation coefficient (R) of -0.148 and weighted average of 90.2%. Similarly, the statistical analysis conducted on geographies consisting of 112,776,758 people shows no correlation between the proportion of Immigrants from Barbados and percentage of households with 1 or more vehicles available in the United States with a correlation coefficient (R) of -0.038 and weighted average of 70.6%, a difference of 27.8%.
1 or more Vehicles in Household Correlation Summary
| Measurement | Bahamian | Immigrants from Barbados |
| Minimum | 78.1% | 31.0% |
| Maximum | 100.0% | 100.0% |
| Range | 21.9% | 69.0% |
| Mean | 91.4% | 80.2% |
| Median | 91.5% | 86.9% |
| Interquartile 25% (IQ1) | 90.1% | 75.4% |
| Interquartile 75% (IQ3) | 93.7% | 91.9% |
| Interquartile Range (IQR) | 3.6% | 16.5% |
| Standard Deviation (Sample) | 4.7% | 18.1% |
| Standard Deviation (Population) | 4.6% | 18.0% |
Similar Demographics by 1 or more Vehicles in Household
Demographics Similar to Bahamians by 1 or more Vehicles in Household
In terms of 1 or more vehicles in household, the demographic groups most similar to Bahamians are Immigrants from Zimbabwe (90.2%, a difference of 0.020%), Sioux (90.2%, a difference of 0.020%), Chilean (90.2%, a difference of 0.020%), Immigrants from Bahamas (90.2%, a difference of 0.030%), and Immigrants from Eastern Africa (90.1%, a difference of 0.050%).
| Demographics | Rating | Rank | 1 or more Vehicles in Household |
| Estonians | 85.6 /100 | #139 | Excellent 90.3% |
| Sudanese | 85.2 /100 | #140 | Excellent 90.3% |
| Immigrants | Moldova | 83.1 /100 | #141 | Excellent 90.2% |
| Immigrants | Lithuania | 83.0 /100 | #142 | Excellent 90.2% |
| Immigrants | Bahamas | 81.5 /100 | #143 | Excellent 90.2% |
| Immigrants | Zimbabwe | 81.5 /100 | #144 | Excellent 90.2% |
| Sioux | 81.3 /100 | #145 | Excellent 90.2% |
| Bahamians | 80.5 /100 | #146 | Excellent 90.2% |
| Chileans | 79.8 /100 | #147 | Good 90.2% |
| Immigrants | Eastern Africa | 78.2 /100 | #148 | Good 90.1% |
| Immigrants | Nicaragua | 76.7 /100 | #149 | Good 90.1% |
| Immigrants | Micronesia | 75.9 /100 | #150 | Good 90.1% |
| Immigrants | Bosnia and Herzegovina | 75.4 /100 | #151 | Good 90.1% |
| Tlingit-Haida | 74.3 /100 | #152 | Good 90.1% |
| New Zealanders | 73.8 /100 | #153 | Good 90.1% |
Demographics Similar to Immigrants from Barbados by 1 or more Vehicles in Household
In terms of 1 or more vehicles in household, the demographic groups most similar to Immigrants from Barbados are Immigrants from Guyana (70.6%, a difference of 0.010%), Dominican (70.7%, a difference of 0.13%), Guyanese (70.8%, a difference of 0.32%), British West Indian (70.4%, a difference of 0.32%), and Inupiat (71.5%, a difference of 1.3%).
| Demographics | Rating | Rank | 1 or more Vehicles in Household |
| Immigrants | Ecuador | 0.0 /100 | #333 | Tragic 76.2% |
| Immigrants | Bangladesh | 0.0 /100 | #334 | Tragic 74.3% |
| Barbadians | 0.0 /100 | #335 | Tragic 74.0% |
| Vietnamese | 0.0 /100 | #336 | Tragic 73.8% |
| Immigrants | Uzbekistan | 0.0 /100 | #337 | Tragic 73.4% |
| Inupiat | 0.0 /100 | #338 | Tragic 71.5% |
| Guyanese | 0.0 /100 | #339 | Tragic 70.8% |
| Dominicans | 0.0 /100 | #340 | Tragic 70.7% |
| Immigrants | Barbados | 0.0 /100 | #341 | Tragic 70.6% |
| Immigrants | Guyana | 0.0 /100 | #342 | Tragic 70.6% |
| British West Indians | 0.0 /100 | #343 | Tragic 70.4% |
| Immigrants | Dominican Republic | 0.0 /100 | #344 | Tragic 68.6% |
| Immigrants | St. Vincent and the Grenadines | 0.0 /100 | #345 | Tragic 64.7% |
| Immigrants | Grenada | 0.0 /100 | #346 | Tragic 62.7% |
| Yup'ik | 0.0 /100 | #347 | Tragic 58.4% |