Brazilian vs Immigrants from Barbados 1 or more Vehicles in Household
COMPARE
Brazilian
Immigrants from Barbados
1 or more Vehicles in Household
1 or more Vehicles in Household Comparison
Brazilians
Immigrants from Barbados
90.0%
1 OR MORE VEHICLES IN HOUSEHOLD
71.0/ 100
METRIC RATING
158th/ 347
METRIC RANK
70.6%
1 OR MORE VEHICLES IN HOUSEHOLD
0.0/ 100
METRIC RATING
341st/ 347
METRIC RANK
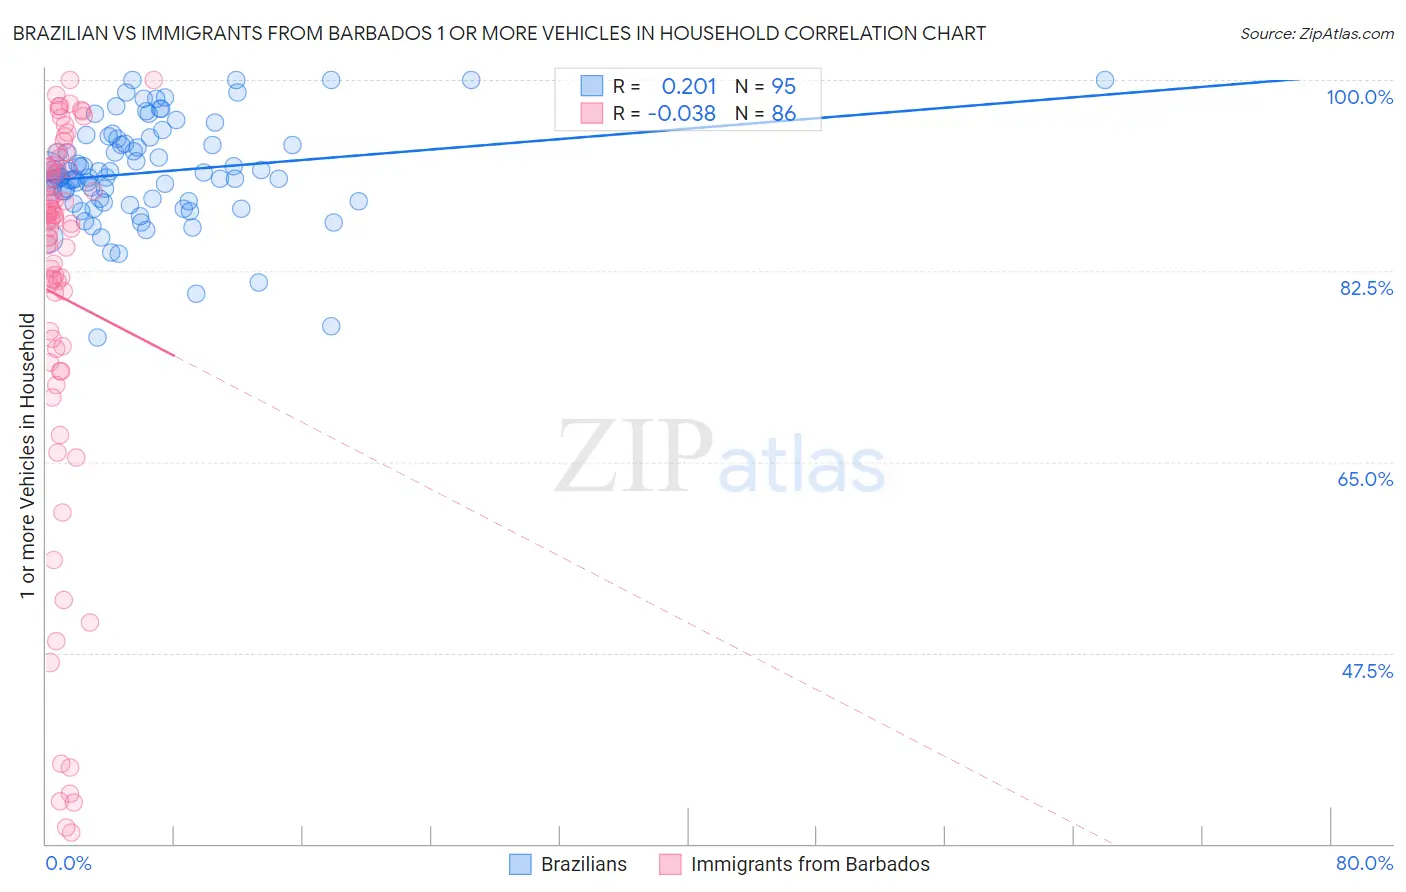
Brazilian vs Immigrants from Barbados 1 or more Vehicles in Household Correlation Chart
The statistical analysis conducted on geographies consisting of 323,363,062 people shows a weak positive correlation between the proportion of Brazilians and percentage of households with 1 or more vehicles available in the United States with a correlation coefficient (R) of 0.201 and weighted average of 90.0%. Similarly, the statistical analysis conducted on geographies consisting of 112,776,758 people shows no correlation between the proportion of Immigrants from Barbados and percentage of households with 1 or more vehicles available in the United States with a correlation coefficient (R) of -0.038 and weighted average of 70.6%, a difference of 27.5%.
1 or more Vehicles in Household Correlation Summary
| Measurement | Brazilian | Immigrants from Barbados |
| Minimum | 76.4% | 31.0% |
| Maximum | 100.0% | 100.0% |
| Range | 23.6% | 69.0% |
| Mean | 91.5% | 80.2% |
| Median | 91.1% | 86.9% |
| Interquartile 25% (IQ1) | 88.8% | 75.4% |
| Interquartile 75% (IQ3) | 94.6% | 91.9% |
| Interquartile Range (IQR) | 5.8% | 16.5% |
| Standard Deviation (Sample) | 4.7% | 18.1% |
| Standard Deviation (Population) | 4.7% | 18.0% |
Similar Demographics by 1 or more Vehicles in Household
Demographics Similar to Brazilians by 1 or more Vehicles in Household
In terms of 1 or more vehicles in household, the demographic groups most similar to Brazilians are Immigrants from Congo (90.0%, a difference of 0.0%), South African (90.0%, a difference of 0.020%), Australian (90.0%, a difference of 0.030%), Immigrants from Indonesia (90.0%, a difference of 0.040%), and Salvadoran (90.0%, a difference of 0.040%).
| Demographics | Rating | Rank | 1 or more Vehicles in Household |
| Immigrants | Bosnia and Herzegovina | 75.4 /100 | #151 | Good 90.1% |
| Tlingit-Haida | 74.3 /100 | #152 | Good 90.1% |
| New Zealanders | 73.8 /100 | #153 | Good 90.1% |
| Immigrants | Uganda | 73.8 /100 | #154 | Good 90.1% |
| Immigrants | Immigrants | 73.6 /100 | #155 | Good 90.1% |
| Australians | 72.4 /100 | #156 | Good 90.0% |
| Immigrants | Congo | 71.2 /100 | #157 | Good 90.0% |
| Brazilians | 71.0 /100 | #158 | Good 90.0% |
| South Africans | 69.7 /100 | #159 | Good 90.0% |
| Immigrants | Indonesia | 68.8 /100 | #160 | Good 90.0% |
| Salvadorans | 68.7 /100 | #161 | Good 90.0% |
| Spanish American Indians | 67.0 /100 | #162 | Good 89.9% |
| Immigrants | Austria | 65.5 /100 | #163 | Good 89.9% |
| Comanche | 63.4 /100 | #164 | Good 89.9% |
| Immigrants | Saudi Arabia | 62.6 /100 | #165 | Good 89.9% |
Demographics Similar to Immigrants from Barbados by 1 or more Vehicles in Household
In terms of 1 or more vehicles in household, the demographic groups most similar to Immigrants from Barbados are Immigrants from Guyana (70.6%, a difference of 0.010%), Dominican (70.7%, a difference of 0.13%), Guyanese (70.8%, a difference of 0.32%), British West Indian (70.4%, a difference of 0.32%), and Inupiat (71.5%, a difference of 1.3%).
| Demographics | Rating | Rank | 1 or more Vehicles in Household |
| Immigrants | Ecuador | 0.0 /100 | #333 | Tragic 76.2% |
| Immigrants | Bangladesh | 0.0 /100 | #334 | Tragic 74.3% |
| Barbadians | 0.0 /100 | #335 | Tragic 74.0% |
| Vietnamese | 0.0 /100 | #336 | Tragic 73.8% |
| Immigrants | Uzbekistan | 0.0 /100 | #337 | Tragic 73.4% |
| Inupiat | 0.0 /100 | #338 | Tragic 71.5% |
| Guyanese | 0.0 /100 | #339 | Tragic 70.8% |
| Dominicans | 0.0 /100 | #340 | Tragic 70.7% |
| Immigrants | Barbados | 0.0 /100 | #341 | Tragic 70.6% |
| Immigrants | Guyana | 0.0 /100 | #342 | Tragic 70.6% |
| British West Indians | 0.0 /100 | #343 | Tragic 70.4% |
| Immigrants | Dominican Republic | 0.0 /100 | #344 | Tragic 68.6% |
| Immigrants | St. Vincent and the Grenadines | 0.0 /100 | #345 | Tragic 64.7% |
| Immigrants | Grenada | 0.0 /100 | #346 | Tragic 62.7% |
| Yup'ik | 0.0 /100 | #347 | Tragic 58.4% |