British vs South American Per Capita Income
COMPARE
British
South American
Per Capita Income
Per Capita Income Comparison
British
South Americans
$46,571
PER CAPITA INCOME
96.3/ 100
METRIC RATING
105th/ 347
METRIC RANK
$44,114
PER CAPITA INCOME
62.4/ 100
METRIC RATING
159th/ 347
METRIC RANK
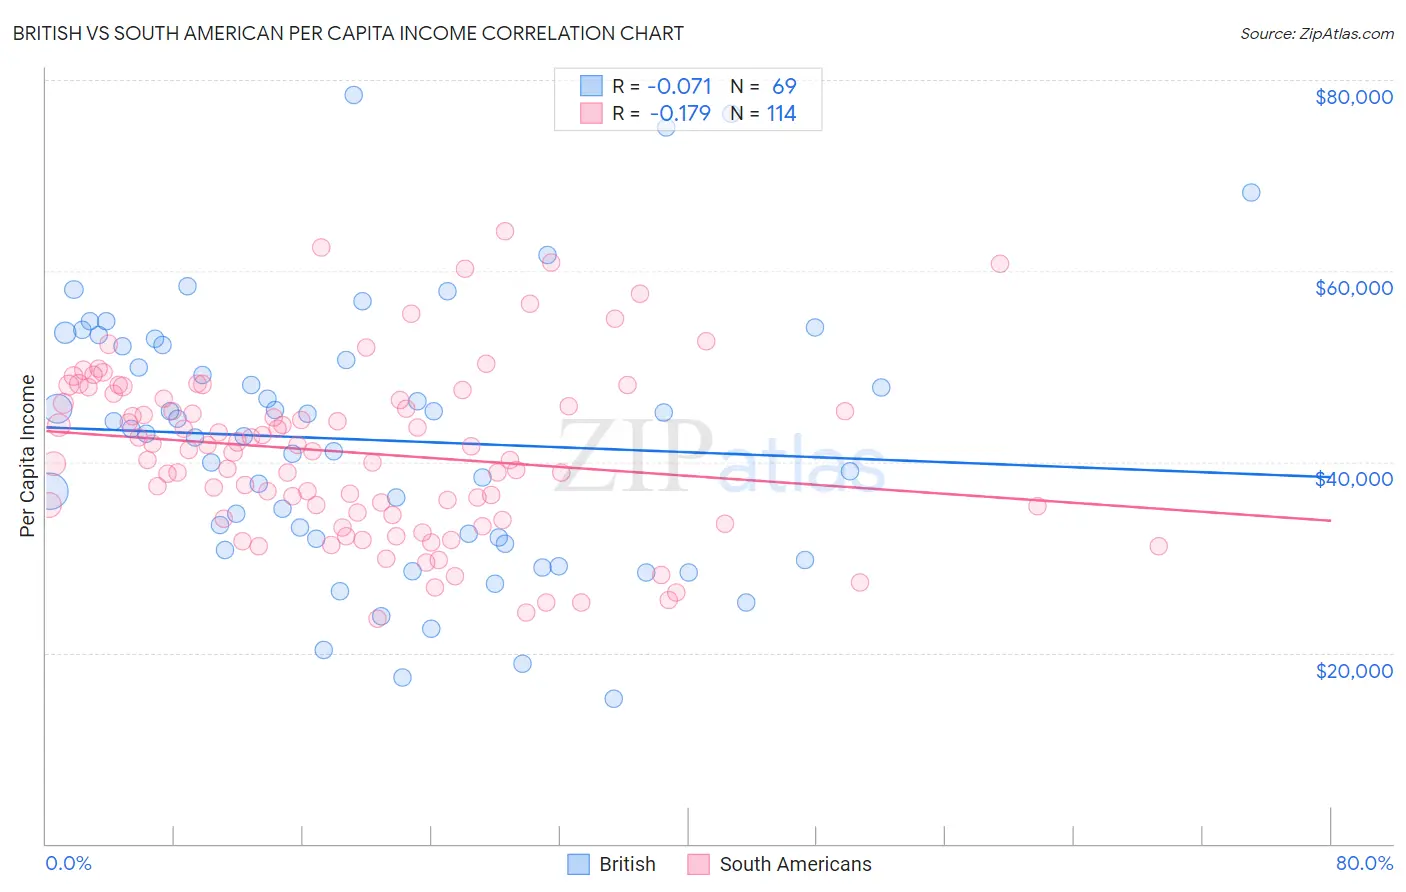
British vs South American Per Capita Income Correlation Chart
The statistical analysis conducted on geographies consisting of 531,509,252 people shows a slight negative correlation between the proportion of British and per capita income in the United States with a correlation coefficient (R) of -0.071 and weighted average of $46,571. Similarly, the statistical analysis conducted on geographies consisting of 494,145,698 people shows a poor negative correlation between the proportion of South Americans and per capita income in the United States with a correlation coefficient (R) of -0.179 and weighted average of $44,114, a difference of 5.6%.
Per Capita Income Correlation Summary
| Measurement | British | South American |
| Minimum | $15,188 | $23,579 |
| Maximum | $78,420 | $64,213 |
| Range | $63,232 | $40,635 |
| Mean | $42,295 | $40,955 |
| Median | $42,961 | $41,221 |
| Interquartile 25% (IQ1) | $31,698 | $34,406 |
| Interquartile 75% (IQ3) | $52,162 | $46,619 |
| Interquartile Range (IQR) | $20,464 | $12,213 |
| Standard Deviation (Sample) | $13,799 | $8,864 |
| Standard Deviation (Population) | $13,699 | $8,825 |
Similar Demographics by Per Capita Income
Demographics Similar to British by Per Capita Income
In terms of per capita income, the demographic groups most similar to British are Ethiopian ($46,569, a difference of 0.0%), Serbian ($46,551, a difference of 0.040%), Immigrants from Kuwait ($46,543, a difference of 0.060%), Immigrants from Northern Africa ($46,531, a difference of 0.090%), and Chilean ($46,459, a difference of 0.24%).
| Demographics | Rating | Rank | Per Capita Income |
| Immigrants | Pakistan | 97.9 /100 | #98 | Exceptional $47,084 |
| Laotians | 97.8 /100 | #99 | Exceptional $47,041 |
| Immigrants | Lebanon | 97.5 /100 | #100 | Exceptional $46,938 |
| Immigrants | Uzbekistan | 97.5 /100 | #101 | Exceptional $46,929 |
| Immigrants | Western Asia | 97.4 /100 | #102 | Exceptional $46,876 |
| Syrians | 97.2 /100 | #103 | Exceptional $46,837 |
| Brazilians | 96.8 /100 | #104 | Exceptional $46,700 |
| British | 96.3 /100 | #105 | Exceptional $46,571 |
| Ethiopians | 96.3 /100 | #106 | Exceptional $46,569 |
| Serbians | 96.2 /100 | #107 | Exceptional $46,551 |
| Immigrants | Kuwait | 96.2 /100 | #108 | Exceptional $46,543 |
| Immigrants | Northern Africa | 96.2 /100 | #109 | Exceptional $46,531 |
| Chileans | 95.9 /100 | #110 | Exceptional $46,459 |
| Taiwanese | 95.8 /100 | #111 | Exceptional $46,455 |
| Immigrants | Morocco | 95.7 /100 | #112 | Exceptional $46,430 |
Demographics Similar to South Americans by Per Capita Income
In terms of per capita income, the demographic groups most similar to South Americans are Danish ($44,095, a difference of 0.040%), Costa Rican ($44,090, a difference of 0.050%), Swiss ($44,076, a difference of 0.090%), Immigrants from South America ($44,068, a difference of 0.10%), and Immigrants from Nepal ($44,187, a difference of 0.17%).
| Demographics | Rating | Rank | Per Capita Income |
| Peruvians | 71.5 /100 | #152 | Good $44,479 |
| Scottish | 70.6 /100 | #153 | Good $44,440 |
| Portuguese | 68.7 /100 | #154 | Good $44,362 |
| Uruguayans | 67.6 /100 | #155 | Good $44,318 |
| Slovaks | 65.4 /100 | #156 | Good $44,229 |
| South American Indians | 64.8 /100 | #157 | Good $44,206 |
| Immigrants | Nepal | 64.3 /100 | #158 | Good $44,187 |
| South Americans | 62.4 /100 | #159 | Good $44,114 |
| Danes | 61.9 /100 | #160 | Good $44,095 |
| Costa Ricans | 61.8 /100 | #161 | Good $44,090 |
| Swiss | 61.4 /100 | #162 | Good $44,076 |
| Immigrants | South America | 61.2 /100 | #163 | Good $44,068 |
| Sri Lankans | 59.8 /100 | #164 | Average $44,014 |
| Immigrants | Philippines | 59.4 /100 | #165 | Average $44,000 |
| Immigrants | Uruguay | 59.3 /100 | #166 | Average $43,997 |