Swiss vs South American 4 or more Vehicles in Household
COMPARE
Swiss
South American
4 or more Vehicles in Household
4 or more Vehicles in Household Comparison
Swiss
South Americans
7.8%
4 OR MORE VEHICLES IN HOUSEHOLD
100.0/ 100
METRIC RATING
48th/ 347
METRIC RANK
5.6%
4 OR MORE VEHICLES IN HOUSEHOLD
0.9/ 100
METRIC RATING
265th/ 347
METRIC RANK
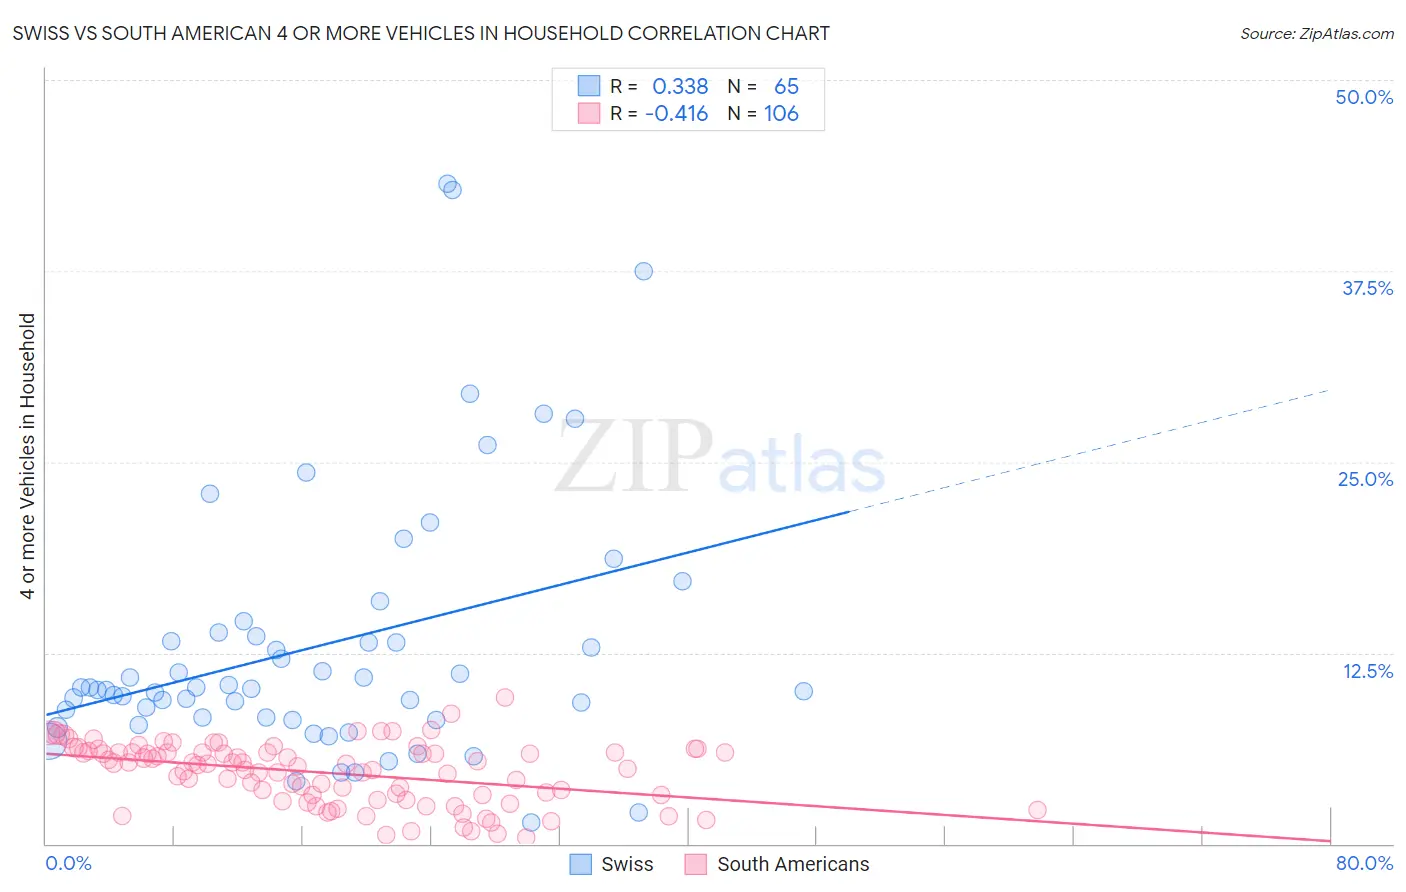
Swiss vs South American 4 or more Vehicles in Household Correlation Chart
The statistical analysis conducted on geographies consisting of 463,313,966 people shows a mild positive correlation between the proportion of Swiss and percentage of households with 4 or more vehicles available in the United States with a correlation coefficient (R) of 0.338 and weighted average of 7.8%. Similarly, the statistical analysis conducted on geographies consisting of 491,409,922 people shows a moderate negative correlation between the proportion of South Americans and percentage of households with 4 or more vehicles available in the United States with a correlation coefficient (R) of -0.416 and weighted average of 5.6%, a difference of 39.3%.
4 or more Vehicles in Household Correlation Summary
| Measurement | Swiss | South American |
| Minimum | 1.4% | 0.44% |
| Maximum | 43.2% | 9.6% |
| Range | 41.8% | 9.1% |
| Mean | 13.0% | 4.6% |
| Median | 10.1% | 5.2% |
| Interquartile 25% (IQ1) | 8.2% | 3.2% |
| Interquartile 75% (IQ3) | 13.7% | 6.0% |
| Interquartile Range (IQR) | 5.5% | 2.8% |
| Standard Deviation (Sample) | 8.7% | 2.0% |
| Standard Deviation (Population) | 8.6% | 2.0% |
Similar Demographics by 4 or more Vehicles in Household
Demographics Similar to Swiss by 4 or more Vehicles in Household
In terms of 4 or more vehicles in household, the demographic groups most similar to Swiss are Osage (7.8%, a difference of 0.17%), Cherokee (7.7%, a difference of 0.19%), Crow (7.8%, a difference of 0.34%), Immigrants from El Salvador (7.7%, a difference of 0.35%), and Choctaw (7.8%, a difference of 0.51%).
| Demographics | Rating | Rank | 4 or more Vehicles in Household |
| Pima | 100.0 /100 | #41 | Exceptional 7.9% |
| Salvadorans | 100.0 /100 | #42 | Exceptional 7.8% |
| Fijians | 100.0 /100 | #43 | Exceptional 7.8% |
| Bhutanese | 100.0 /100 | #44 | Exceptional 7.8% |
| Choctaw | 100.0 /100 | #45 | Exceptional 7.8% |
| Crow | 100.0 /100 | #46 | Exceptional 7.8% |
| Osage | 100.0 /100 | #47 | Exceptional 7.8% |
| Swiss | 100.0 /100 | #48 | Exceptional 7.8% |
| Cherokee | 100.0 /100 | #49 | Exceptional 7.7% |
| Immigrants | El Salvador | 100.0 /100 | #50 | Exceptional 7.7% |
| Immigrants | Laos | 100.0 /100 | #51 | Exceptional 7.7% |
| Japanese | 100.0 /100 | #52 | Exceptional 7.7% |
| Malaysians | 100.0 /100 | #53 | Exceptional 7.7% |
| Dutch | 100.0 /100 | #54 | Exceptional 7.7% |
| Immigrants | Oceania | 100.0 /100 | #55 | Exceptional 7.6% |
Demographics Similar to South Americans by 4 or more Vehicles in Household
In terms of 4 or more vehicles in household, the demographic groups most similar to South Americans are Immigrants from Nepal (5.6%, a difference of 0.020%), Immigrants from Ukraine (5.6%, a difference of 0.11%), Immigrants from Africa (5.6%, a difference of 0.22%), Colombian (5.5%, a difference of 0.54%), and Carpatho Rusyn (5.5%, a difference of 0.69%).
| Demographics | Rating | Rank | 4 or more Vehicles in Household |
| Immigrants | Lithuania | 1.4 /100 | #258 | Tragic 5.6% |
| Immigrants | France | 1.3 /100 | #259 | Tragic 5.6% |
| Uruguayans | 1.3 /100 | #260 | Tragic 5.6% |
| Sudanese | 1.2 /100 | #261 | Tragic 5.6% |
| Bermudans | 1.2 /100 | #262 | Tragic 5.6% |
| Immigrants | Saudi Arabia | 1.1 /100 | #263 | Tragic 5.6% |
| Immigrants | Africa | 1.0 /100 | #264 | Tragic 5.6% |
| South Americans | 0.9 /100 | #265 | Tragic 5.6% |
| Immigrants | Nepal | 0.9 /100 | #266 | Tragic 5.6% |
| Immigrants | Ukraine | 0.9 /100 | #267 | Tragic 5.6% |
| Colombians | 0.7 /100 | #268 | Tragic 5.5% |
| Carpatho Rusyns | 0.7 /100 | #269 | Tragic 5.5% |
| Okinawans | 0.6 /100 | #270 | Tragic 5.5% |
| Immigrants | Sudan | 0.6 /100 | #271 | Tragic 5.5% |
| Immigrants | Kazakhstan | 0.6 /100 | #272 | Tragic 5.5% |