British vs Chippewa 2nd Grade
COMPARE
British
Chippewa
2nd Grade
2nd Grade Comparison
British
Chippewa
98.5%
2ND GRADE
100.0/ 100
METRIC RATING
36th/ 347
METRIC RANK
98.4%
2ND GRADE
99.9/ 100
METRIC RATING
39th/ 347
METRIC RANK
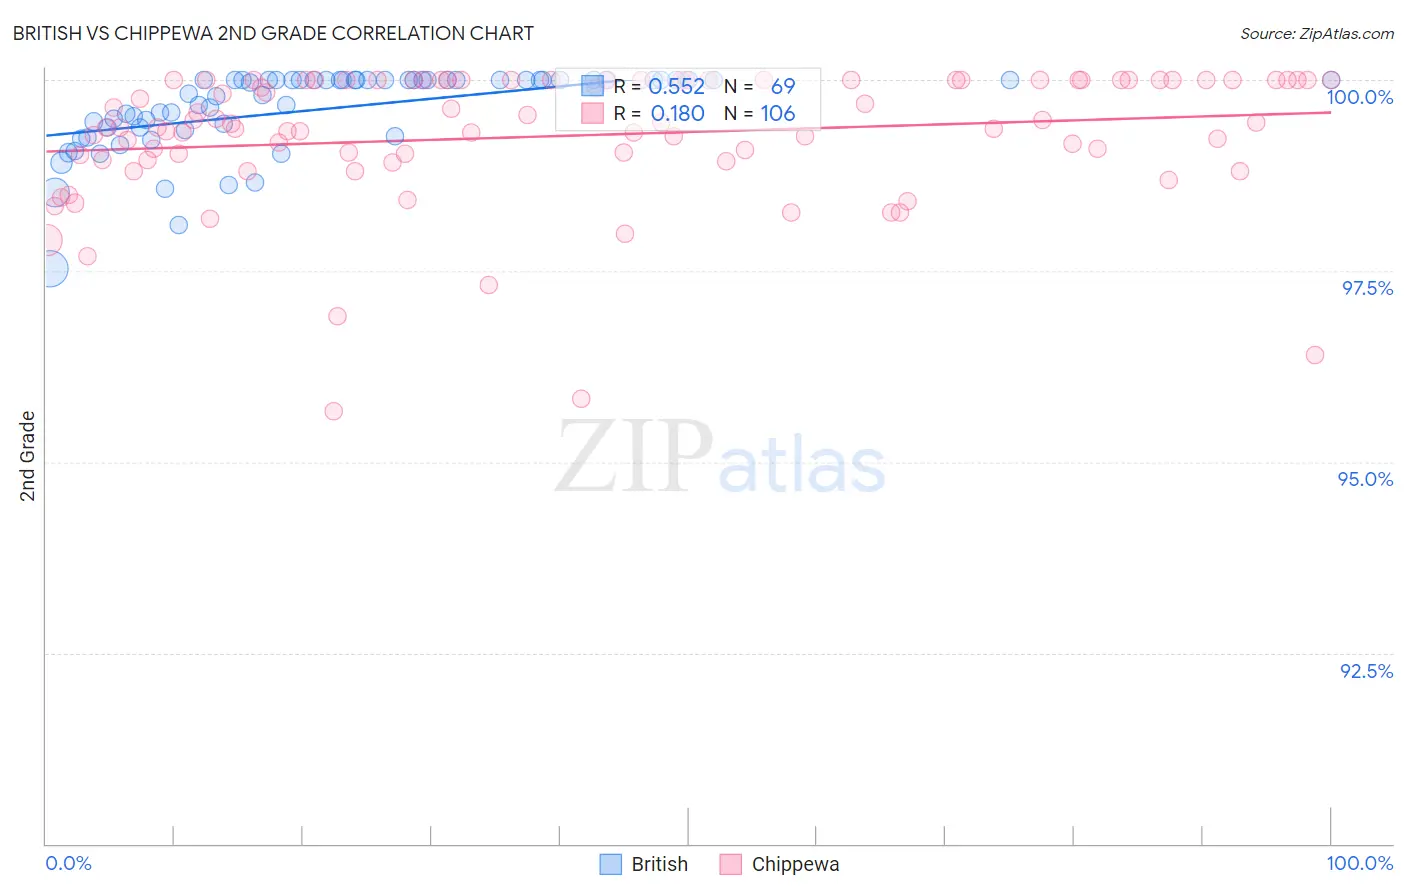
British vs Chippewa 2nd Grade Correlation Chart
The statistical analysis conducted on geographies consisting of 531,462,526 people shows a substantial positive correlation between the proportion of British and percentage of population with at least 2nd grade education in the United States with a correlation coefficient (R) of 0.552 and weighted average of 98.5%. Similarly, the statistical analysis conducted on geographies consisting of 215,065,644 people shows a poor positive correlation between the proportion of Chippewa and percentage of population with at least 2nd grade education in the United States with a correlation coefficient (R) of 0.180 and weighted average of 98.4%, a difference of 0.030%.
2nd Grade Correlation Summary
| Measurement | British | Chippewa |
| Minimum | 97.5% | 95.7% |
| Maximum | 100.0% | 100.0% |
| Range | 2.5% | 4.3% |
| Mean | 99.6% | 99.3% |
| Median | 100.0% | 99.4% |
| Interquartile 25% (IQ1) | 99.4% | 99.0% |
| Interquartile 75% (IQ3) | 100.0% | 100.0% |
| Interquartile Range (IQR) | 0.64% | 1.0% |
| Standard Deviation (Sample) | 0.53% | 0.88% |
| Standard Deviation (Population) | 0.53% | 0.88% |
Demographics Similar to British and Chippewa by 2nd Grade
In terms of 2nd grade, the demographic groups most similar to British are Chinese (98.5%, a difference of 0.020%), Swiss (98.5%, a difference of 0.020%), Italian (98.4%, a difference of 0.020%), Latvian (98.4%, a difference of 0.030%), and Luxembourger (98.4%, a difference of 0.030%). Similarly, the demographic groups most similar to Chippewa are Latvian (98.4%, a difference of 0.0%), Italian (98.4%, a difference of 0.010%), Luxembourger (98.4%, a difference of 0.010%), Eastern European (98.4%, a difference of 0.010%), and Native Hawaiian (98.4%, a difference of 0.020%).
| Demographics | Rating | Rank | 2nd Grade |
| Croatians | 100.0 /100 | #27 | Exceptional 98.5% |
| Arapaho | 100.0 /100 | #28 | Exceptional 98.5% |
| French | 100.0 /100 | #29 | Exceptional 98.5% |
| Europeans | 100.0 /100 | #30 | Exceptional 98.5% |
| Czechs | 100.0 /100 | #31 | Exceptional 98.5% |
| French Canadians | 100.0 /100 | #32 | Exceptional 98.5% |
| Scandinavians | 100.0 /100 | #33 | Exceptional 98.5% |
| Chinese | 100.0 /100 | #34 | Exceptional 98.5% |
| Swiss | 100.0 /100 | #35 | Exceptional 98.5% |
| British | 100.0 /100 | #36 | Exceptional 98.5% |
| Italians | 99.9 /100 | #37 | Exceptional 98.4% |
| Latvians | 99.9 /100 | #38 | Exceptional 98.4% |
| Chippewa | 99.9 /100 | #39 | Exceptional 98.4% |
| Luxembourgers | 99.9 /100 | #40 | Exceptional 98.4% |
| Eastern Europeans | 99.9 /100 | #41 | Exceptional 98.4% |
| Native Hawaiians | 99.9 /100 | #42 | Exceptional 98.4% |
| Belgians | 99.9 /100 | #43 | Exceptional 98.4% |
| Northern Europeans | 99.9 /100 | #44 | Exceptional 98.4% |
| Hungarians | 99.9 /100 | #45 | Exceptional 98.4% |
| Lumbee | 99.9 /100 | #46 | Exceptional 98.4% |
| Ottawa | 99.9 /100 | #47 | Exceptional 98.4% |