Brazilian vs Immigrants from Spain No Vehicles in Household
COMPARE
Brazilian
Immigrants from Spain
No Vehicles in Household
No Vehicles in Household Comparison
Brazilians
Immigrants from Spain
10.4%
NO VEHICLES IN HOUSEHOLD
51.7/ 100
METRIC RATING
172nd/ 347
METRIC RANK
14.5%
NO VEHICLES IN HOUSEHOLD
0.0/ 100
METRIC RATING
296th/ 347
METRIC RANK
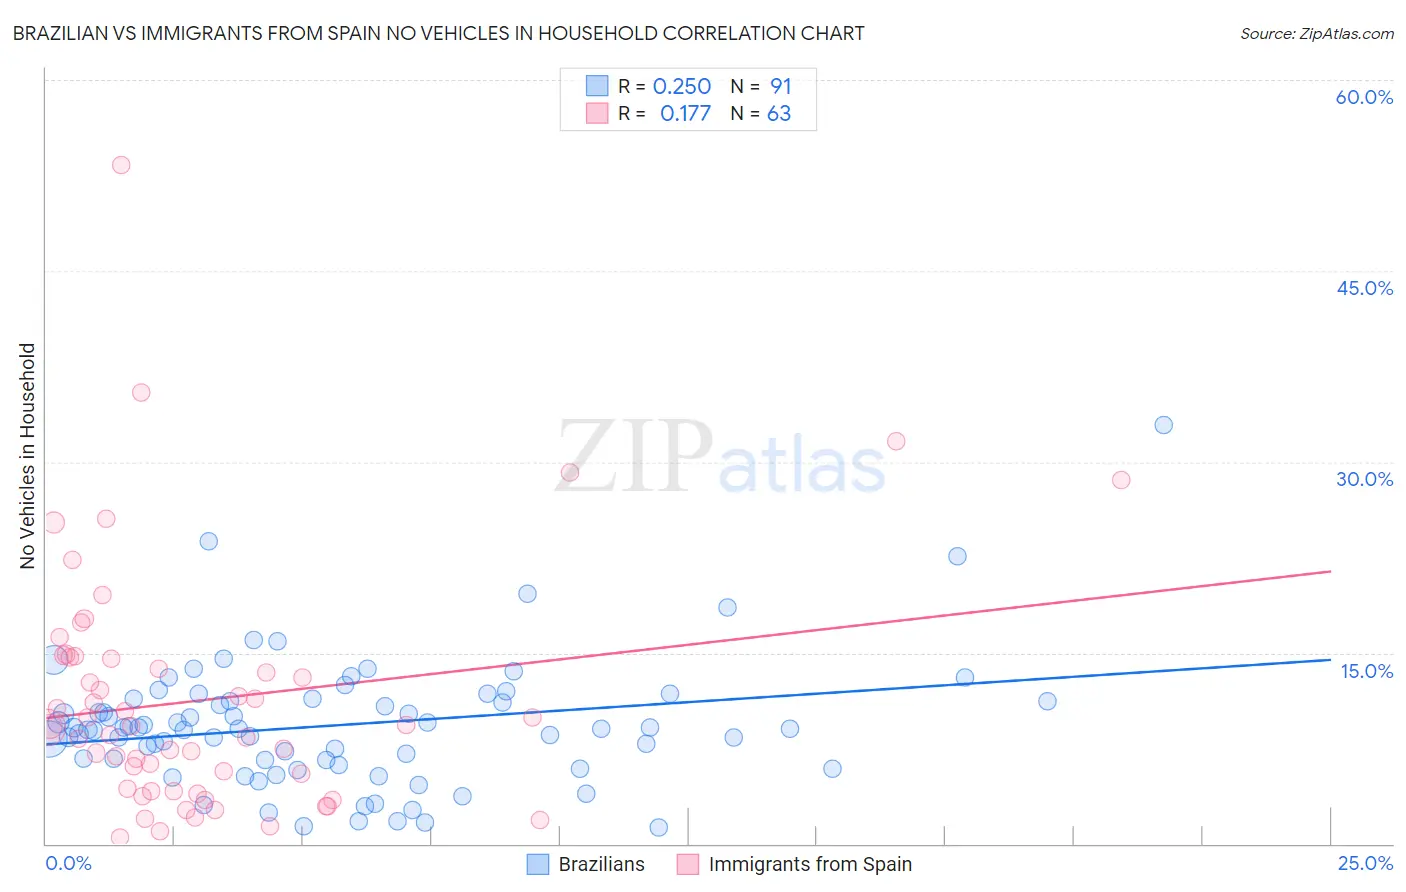
Brazilian vs Immigrants from Spain No Vehicles in Household Correlation Chart
The statistical analysis conducted on geographies consisting of 322,964,874 people shows a weak positive correlation between the proportion of Brazilians and percentage of households with no vehicle available in the United States with a correlation coefficient (R) of 0.250 and weighted average of 10.4%. Similarly, the statistical analysis conducted on geographies consisting of 239,372,096 people shows a poor positive correlation between the proportion of Immigrants from Spain and percentage of households with no vehicle available in the United States with a correlation coefficient (R) of 0.177 and weighted average of 14.5%, a difference of 40.1%.
No Vehicles in Household Correlation Summary
| Measurement | Brazilian | Immigrants from Spain |
| Minimum | 1.2% | 0.51% |
| Maximum | 32.9% | 53.3% |
| Range | 31.6% | 52.8% |
| Mean | 9.3% | 11.3% |
| Median | 9.0% | 9.2% |
| Interquartile 25% (IQ1) | 6.6% | 4.1% |
| Interquartile 75% (IQ3) | 11.4% | 14.6% |
| Interquartile Range (IQR) | 4.8% | 10.5% |
| Standard Deviation (Sample) | 5.0% | 9.6% |
| Standard Deviation (Population) | 5.0% | 9.5% |
Similar Demographics by No Vehicles in Household
Demographics Similar to Brazilians by No Vehicles in Household
In terms of no vehicles in household, the demographic groups most similar to Brazilians are Hmong (10.4%, a difference of 0.14%), Immigrants from Latin America (10.4%, a difference of 0.21%), Filipino (10.4%, a difference of 0.22%), Immigrants from Sudan (10.4%, a difference of 0.23%), and Immigrants from Burma/Myanmar (10.4%, a difference of 0.34%).
| Demographics | Rating | Rank | No Vehicles in Household |
| Comanche | 60.8 /100 | #165 | Good 10.2% |
| Immigrants | Costa Rica | 60.5 /100 | #166 | Good 10.3% |
| Immigrants | Saudi Arabia | 58.8 /100 | #167 | Average 10.3% |
| Indonesians | 56.7 /100 | #168 | Average 10.3% |
| Lumbee | 54.7 /100 | #169 | Average 10.3% |
| Immigrants | Latin America | 53.2 /100 | #170 | Average 10.4% |
| Hmong | 52.7 /100 | #171 | Average 10.4% |
| Brazilians | 51.7 /100 | #172 | Average 10.4% |
| Filipinos | 50.1 /100 | #173 | Average 10.4% |
| Immigrants | Sudan | 50.0 /100 | #174 | Average 10.4% |
| Immigrants | Burma/Myanmar | 49.1 /100 | #175 | Average 10.4% |
| French American Indians | 49.1 /100 | #176 | Average 10.4% |
| Immigrants | El Salvador | 49.1 /100 | #177 | Average 10.4% |
| Immigrants | Ethiopia | 48.0 /100 | #178 | Average 10.4% |
| Ethiopians | 45.8 /100 | #179 | Average 10.5% |
Demographics Similar to Immigrants from Spain by No Vehicles in Household
In terms of no vehicles in household, the demographic groups most similar to Immigrants from Spain are Immigrants from Panama (14.6%, a difference of 0.67%), Moroccan (14.7%, a difference of 0.82%), Immigrants from Greece (14.7%, a difference of 1.0%), Paraguayan (14.4%, a difference of 1.3%), and Belizean (14.3%, a difference of 1.5%).
| Demographics | Rating | Rank | No Vehicles in Household |
| Immigrants | Australia | 0.0 /100 | #289 | Tragic 13.8% |
| Indians (Asian) | 0.0 /100 | #290 | Tragic 14.1% |
| Okinawans | 0.0 /100 | #291 | Tragic 14.1% |
| Pima | 0.0 /100 | #292 | Tragic 14.1% |
| Immigrants | Jamaica | 0.0 /100 | #293 | Tragic 14.2% |
| Belizeans | 0.0 /100 | #294 | Tragic 14.3% |
| Paraguayans | 0.0 /100 | #295 | Tragic 14.4% |
| Immigrants | Spain | 0.0 /100 | #296 | Tragic 14.5% |
| Immigrants | Panama | 0.0 /100 | #297 | Tragic 14.6% |
| Moroccans | 0.0 /100 | #298 | Tragic 14.7% |
| Immigrants | Greece | 0.0 /100 | #299 | Tragic 14.7% |
| Yuman | 0.0 /100 | #300 | Tragic 14.9% |
| Immigrants | Ukraine | 0.0 /100 | #301 | Tragic 14.9% |
| Haitians | 0.0 /100 | #302 | Tragic 14.9% |
| Immigrants | Western Africa | 0.0 /100 | #303 | Tragic 15.0% |