Brazilian vs Immigrants from Micronesia No Vehicles in Household
COMPARE
Brazilian
Immigrants from Micronesia
No Vehicles in Household
No Vehicles in Household Comparison
Brazilians
Immigrants from Micronesia
10.4%
NO VEHICLES IN HOUSEHOLD
51.7/ 100
METRIC RATING
172nd/ 347
METRIC RANK
10.1%
NO VEHICLES IN HOUSEHOLD
70.9/ 100
METRIC RATING
156th/ 347
METRIC RANK
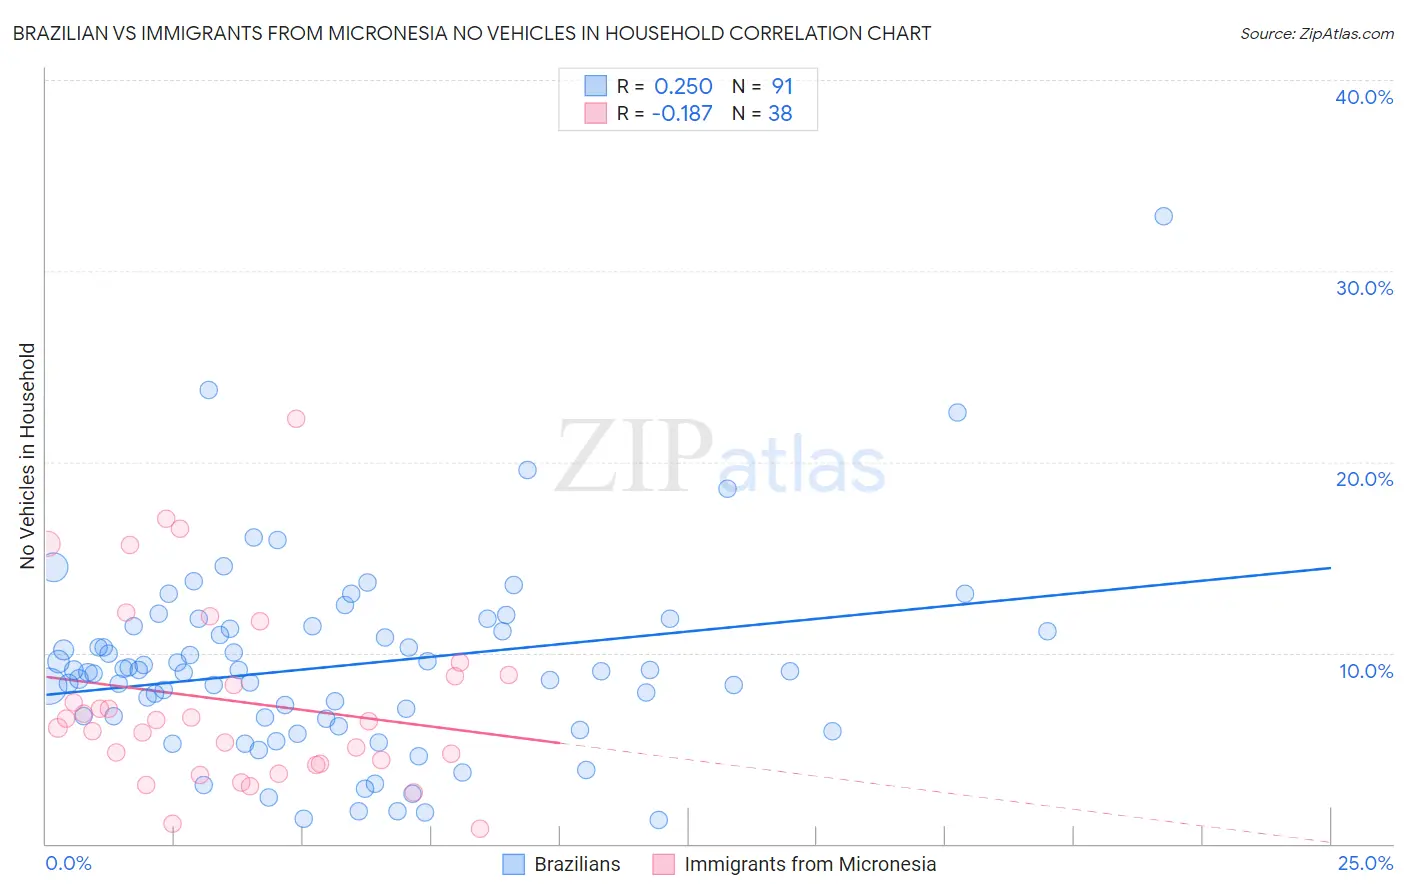
Brazilian vs Immigrants from Micronesia No Vehicles in Household Correlation Chart
The statistical analysis conducted on geographies consisting of 322,964,874 people shows a weak positive correlation between the proportion of Brazilians and percentage of households with no vehicle available in the United States with a correlation coefficient (R) of 0.250 and weighted average of 10.4%. Similarly, the statistical analysis conducted on geographies consisting of 61,571,663 people shows a poor negative correlation between the proportion of Immigrants from Micronesia and percentage of households with no vehicle available in the United States with a correlation coefficient (R) of -0.187 and weighted average of 10.1%, a difference of 2.9%.
No Vehicles in Household Correlation Summary
| Measurement | Brazilian | Immigrants from Micronesia |
| Minimum | 1.2% | 0.77% |
| Maximum | 32.9% | 22.3% |
| Range | 31.6% | 21.5% |
| Mean | 9.3% | 7.5% |
| Median | 9.0% | 6.4% |
| Interquartile 25% (IQ1) | 6.6% | 4.2% |
| Interquartile 75% (IQ3) | 11.4% | 8.8% |
| Interquartile Range (IQR) | 4.8% | 4.7% |
| Standard Deviation (Sample) | 5.0% | 4.8% |
| Standard Deviation (Population) | 5.0% | 4.7% |
Demographics Similar to Brazilians and Immigrants from Micronesia by No Vehicles in Household
In terms of no vehicles in household, the demographic groups most similar to Brazilians are Hmong (10.4%, a difference of 0.14%), Immigrants from Latin America (10.4%, a difference of 0.21%), Filipino (10.4%, a difference of 0.22%), Immigrants from Sudan (10.4%, a difference of 0.23%), and Lumbee (10.3%, a difference of 0.42%). Similarly, the demographic groups most similar to Immigrants from Micronesia are Australian (10.1%, a difference of 0.050%), Spanish American Indian (10.1%, a difference of 0.11%), Salvadoran (10.1%, a difference of 0.25%), Immigrants from Indonesia (10.1%, a difference of 0.26%), and Sioux (10.1%, a difference of 0.27%).
| Demographics | Rating | Rank | No Vehicles in Household |
| Sioux | 72.4 /100 | #154 | Good 10.1% |
| Salvadorans | 72.4 /100 | #155 | Good 10.1% |
| Immigrants | Micronesia | 70.9 /100 | #156 | Good 10.1% |
| Australians | 70.6 /100 | #157 | Good 10.1% |
| Spanish American Indians | 70.2 /100 | #158 | Good 10.1% |
| Immigrants | Indonesia | 69.3 /100 | #159 | Good 10.1% |
| Immigrants | Middle Africa | 65.7 /100 | #160 | Good 10.2% |
| New Zealanders | 65.1 /100 | #161 | Good 10.2% |
| Immigrants | Austria | 64.4 /100 | #162 | Good 10.2% |
| Immigrants | Cambodia | 63.7 /100 | #163 | Good 10.2% |
| South Africans | 61.1 /100 | #164 | Good 10.2% |
| Comanche | 60.8 /100 | #165 | Good 10.2% |
| Immigrants | Costa Rica | 60.5 /100 | #166 | Good 10.3% |
| Immigrants | Saudi Arabia | 58.8 /100 | #167 | Average 10.3% |
| Indonesians | 56.7 /100 | #168 | Average 10.3% |
| Lumbee | 54.7 /100 | #169 | Average 10.3% |
| Immigrants | Latin America | 53.2 /100 | #170 | Average 10.4% |
| Hmong | 52.7 /100 | #171 | Average 10.4% |
| Brazilians | 51.7 /100 | #172 | Average 10.4% |
| Filipinos | 50.1 /100 | #173 | Average 10.4% |
| Immigrants | Sudan | 50.0 /100 | #174 | Average 10.4% |