Brazilian vs Central American Householder Income Ages 25 - 44 years
COMPARE
Brazilian
Central American
Householder Income Ages 25 - 44 years
Householder Income Ages 25 - 44 years Comparison
Brazilians
Central Americans
$98,267
HOUSEHOLDER INCOME AGES 25 - 44 YEARS
88.6/ 100
METRIC RATING
129th/ 347
METRIC RANK
$85,144
HOUSEHOLDER INCOME AGES 25 - 44 YEARS
0.5/ 100
METRIC RATING
256th/ 347
METRIC RANK
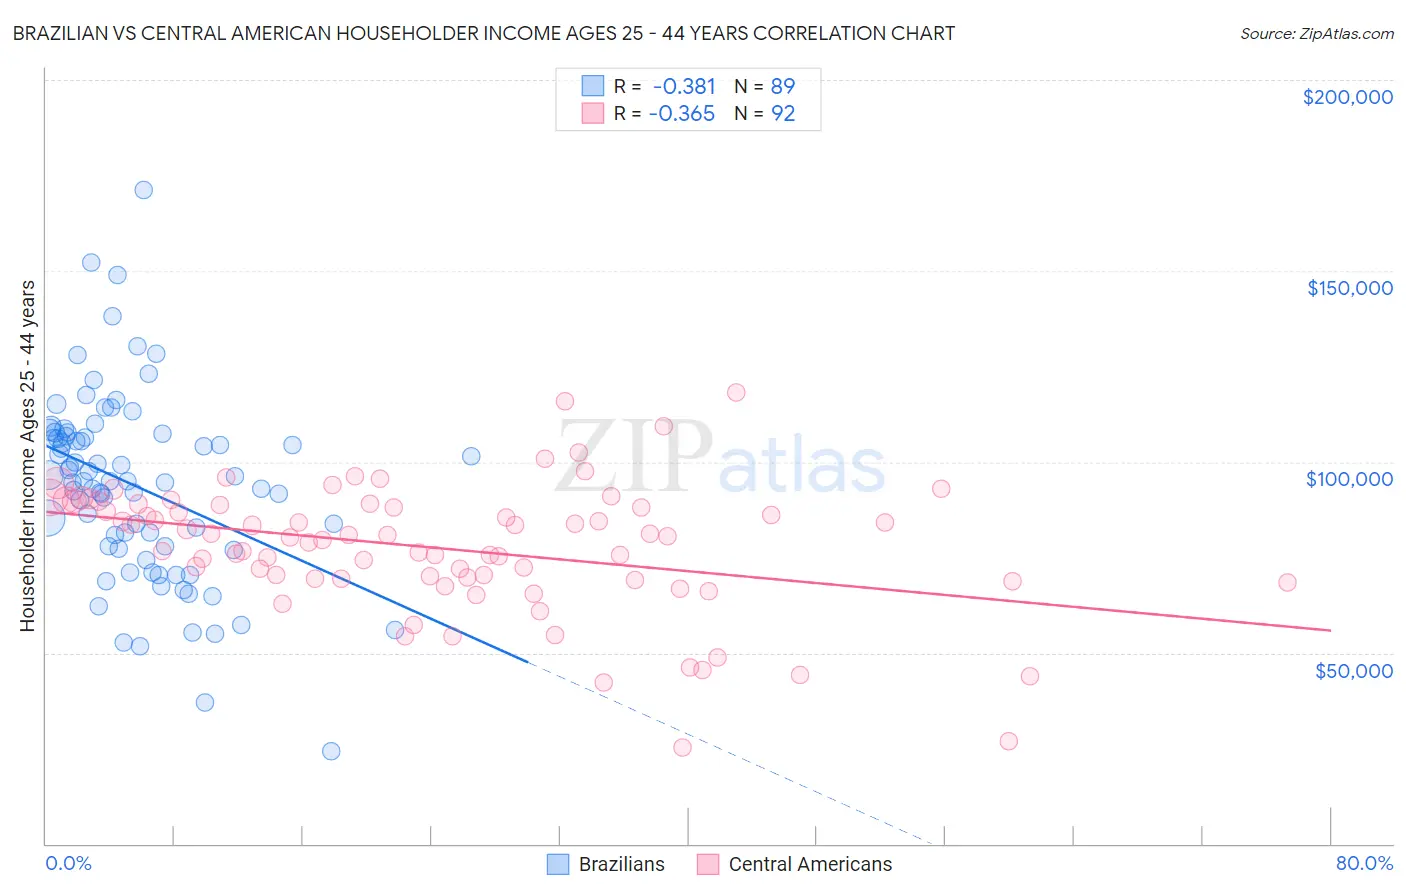
Brazilian vs Central American Householder Income Ages 25 - 44 years Correlation Chart
The statistical analysis conducted on geographies consisting of 323,332,092 people shows a mild negative correlation between the proportion of Brazilians and household income with householder between the ages 25 and 44 in the United States with a correlation coefficient (R) of -0.381 and weighted average of $98,267. Similarly, the statistical analysis conducted on geographies consisting of 502,385,785 people shows a mild negative correlation between the proportion of Central Americans and household income with householder between the ages 25 and 44 in the United States with a correlation coefficient (R) of -0.365 and weighted average of $85,144, a difference of 15.4%.
Householder Income Ages 25 - 44 years Correlation Summary
| Measurement | Brazilian | Central American |
| Minimum | $24,240 | $25,224 |
| Maximum | $171,042 | $118,125 |
| Range | $146,802 | $92,901 |
| Mean | $93,547 | $77,483 |
| Median | $94,950 | $80,487 |
| Interquartile 25% (IQ1) | $77,657 | $69,364 |
| Interquartile 75% (IQ3) | $107,059 | $88,864 |
| Interquartile Range (IQR) | $29,402 | $19,500 |
| Standard Deviation (Sample) | $24,480 | $16,910 |
| Standard Deviation (Population) | $24,342 | $16,818 |
Similar Demographics by Householder Income Ages 25 - 44 years
Demographics Similar to Brazilians by Householder Income Ages 25 - 44 years
In terms of householder income ages 25 - 44 years, the demographic groups most similar to Brazilians are European ($98,310, a difference of 0.040%), Serbian ($98,320, a difference of 0.050%), British ($98,359, a difference of 0.090%), Pakistani ($98,401, a difference of 0.14%), and Immigrants from Kuwait ($98,122, a difference of 0.15%).
| Demographics | Rating | Rank | Householder Income Ages 25 - 44 years |
| Immigrants | Uzbekistan | 91.5 /100 | #122 | Exceptional $98,849 |
| Palestinians | 91.2 /100 | #123 | Exceptional $98,777 |
| Zimbabweans | 90.3 /100 | #124 | Exceptional $98,586 |
| Pakistanis | 89.3 /100 | #125 | Excellent $98,401 |
| British | 89.1 /100 | #126 | Excellent $98,359 |
| Serbians | 88.9 /100 | #127 | Excellent $98,320 |
| Europeans | 88.9 /100 | #128 | Excellent $98,310 |
| Brazilians | 88.6 /100 | #129 | Excellent $98,267 |
| Immigrants | Kuwait | 87.8 /100 | #130 | Excellent $98,122 |
| Immigrants | Albania | 86.6 /100 | #131 | Excellent $97,929 |
| Immigrants | Zimbabwe | 86.3 /100 | #132 | Excellent $97,880 |
| Tsimshian | 85.8 /100 | #133 | Excellent $97,809 |
| Canadians | 84.5 /100 | #134 | Excellent $97,625 |
| Immigrants | Oceania | 84.5 /100 | #135 | Excellent $97,623 |
| Hungarians | 83.9 /100 | #136 | Excellent $97,544 |
Demographics Similar to Central Americans by Householder Income Ages 25 - 44 years
In terms of householder income ages 25 - 44 years, the demographic groups most similar to Central Americans are German Russian ($85,220, a difference of 0.090%), Mexican American Indian ($85,066, a difference of 0.090%), Immigrants from Nicaragua ($84,914, a difference of 0.27%), Immigrants from Senegal ($84,848, a difference of 0.35%), and American ($84,791, a difference of 0.42%).
| Demographics | Rating | Rank | Householder Income Ages 25 - 44 years |
| French American Indians | 0.8 /100 | #249 | Tragic $85,899 |
| Pennsylvania Germans | 0.8 /100 | #250 | Tragic $85,836 |
| Cape Verdeans | 0.8 /100 | #251 | Tragic $85,758 |
| Immigrants | Western Africa | 0.7 /100 | #252 | Tragic $85,676 |
| British West Indians | 0.7 /100 | #253 | Tragic $85,565 |
| Immigrants | Laos | 0.7 /100 | #254 | Tragic $85,553 |
| German Russians | 0.6 /100 | #255 | Tragic $85,220 |
| Central Americans | 0.5 /100 | #256 | Tragic $85,144 |
| Mexican American Indians | 0.5 /100 | #257 | Tragic $85,066 |
| Immigrants | Nicaragua | 0.5 /100 | #258 | Tragic $84,914 |
| Immigrants | Senegal | 0.5 /100 | #259 | Tragic $84,848 |
| Americans | 0.4 /100 | #260 | Tragic $84,791 |
| Inupiat | 0.4 /100 | #261 | Tragic $84,619 |
| Cree | 0.4 /100 | #262 | Tragic $84,574 |
| Belizeans | 0.4 /100 | #263 | Tragic $84,534 |