Blackfeet vs Alsatian 4 or more Vehicles in Household
COMPARE
Blackfeet
Alsatian
4 or more Vehicles in Household
4 or more Vehicles in Household Comparison
Blackfeet
Alsatians
7.0%
4 OR MORE VEHICLES IN HOUSEHOLD
98.6/ 100
METRIC RATING
103rd/ 347
METRIC RANK
5.4%
4 OR MORE VEHICLES IN HOUSEHOLD
0.3/ 100
METRIC RATING
280th/ 347
METRIC RANK
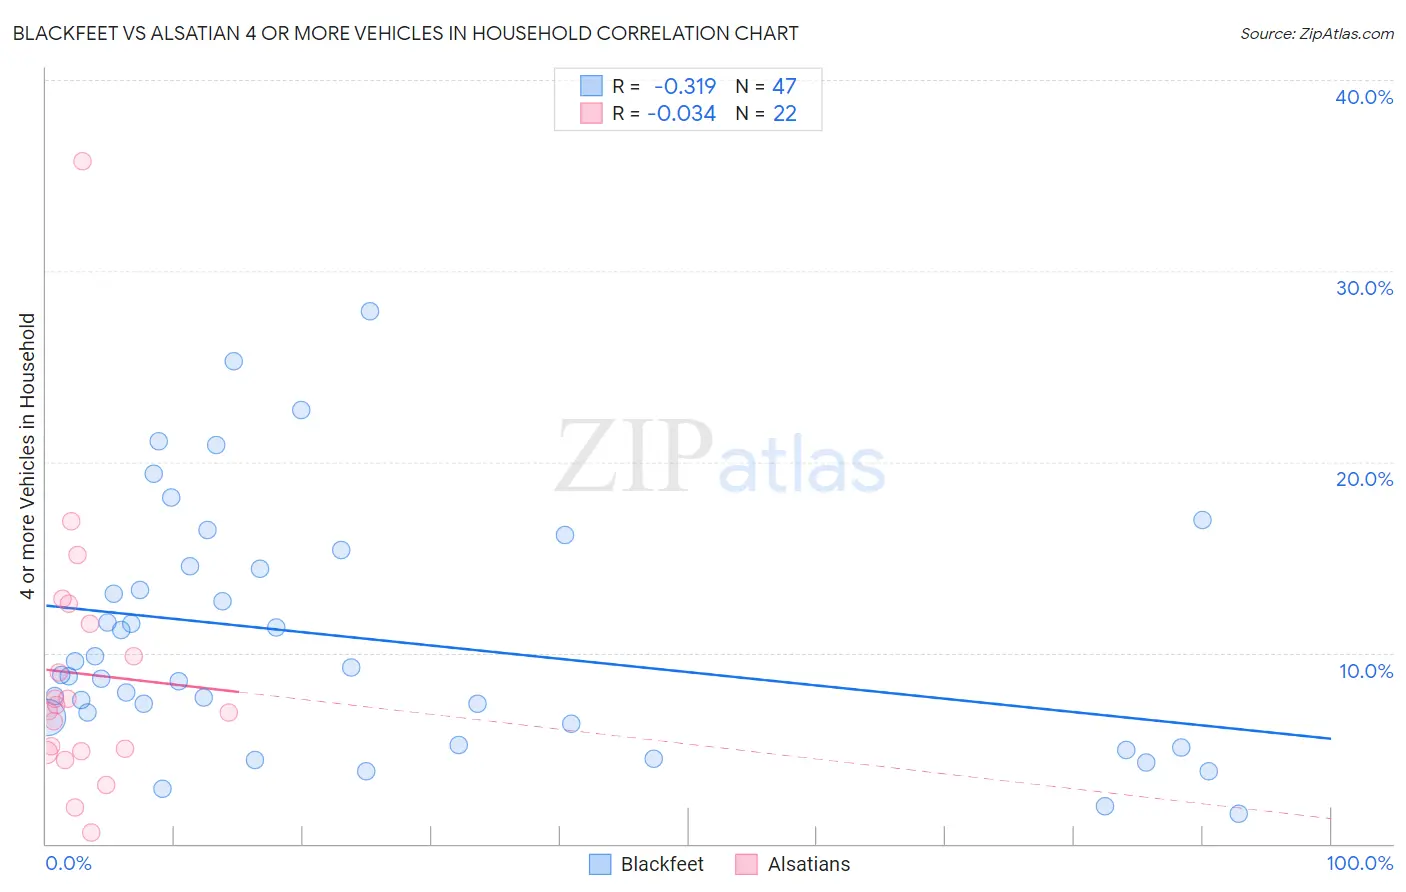
Blackfeet vs Alsatian 4 or more Vehicles in Household Correlation Chart
The statistical analysis conducted on geographies consisting of 308,735,015 people shows a mild negative correlation between the proportion of Blackfeet and percentage of households with 4 or more vehicles available in the United States with a correlation coefficient (R) of -0.319 and weighted average of 7.0%. Similarly, the statistical analysis conducted on geographies consisting of 82,502,049 people shows no correlation between the proportion of Alsatians and percentage of households with 4 or more vehicles available in the United States with a correlation coefficient (R) of -0.034 and weighted average of 5.4%, a difference of 29.6%.
4 or more Vehicles in Household Correlation Summary
| Measurement | Blackfeet | Alsatian |
| Minimum | 1.6% | 0.60% |
| Maximum | 27.9% | 35.7% |
| Range | 26.3% | 35.1% |
| Mean | 10.7% | 8.9% |
| Median | 8.8% | 7.1% |
| Interquartile 25% (IQ1) | 6.3% | 4.8% |
| Interquartile 75% (IQ3) | 14.5% | 11.5% |
| Interquartile Range (IQR) | 8.2% | 6.7% |
| Standard Deviation (Sample) | 6.3% | 7.3% |
| Standard Deviation (Population) | 6.2% | 7.1% |
Similar Demographics by 4 or more Vehicles in Household
Demographics Similar to Blackfeet by 4 or more Vehicles in Household
In terms of 4 or more vehicles in household, the demographic groups most similar to Blackfeet are Asian (7.0%, a difference of 0.010%), Pakistani (7.0%, a difference of 0.080%), Taiwanese (7.0%, a difference of 0.15%), Seminole (7.0%, a difference of 0.22%), and Hmong (7.0%, a difference of 0.48%).
| Demographics | Rating | Rank | 4 or more Vehicles in Household |
| Central Americans | 99.3 /100 | #96 | Exceptional 7.1% |
| Celtics | 99.1 /100 | #97 | Exceptional 7.1% |
| Irish | 99.0 /100 | #98 | Exceptional 7.1% |
| Seminole | 98.8 /100 | #99 | Exceptional 7.0% |
| Taiwanese | 98.7 /100 | #100 | Exceptional 7.0% |
| Pakistanis | 98.7 /100 | #101 | Exceptional 7.0% |
| Asians | 98.6 /100 | #102 | Exceptional 7.0% |
| Blackfeet | 98.6 /100 | #103 | Exceptional 7.0% |
| Hmong | 98.3 /100 | #104 | Exceptional 7.0% |
| German Russians | 98.3 /100 | #105 | Exceptional 7.0% |
| Guatemalans | 98.1 /100 | #106 | Exceptional 7.0% |
| Nicaraguans | 98.0 /100 | #107 | Exceptional 7.0% |
| French | 97.7 /100 | #108 | Exceptional 6.9% |
| Filipinos | 97.6 /100 | #109 | Exceptional 6.9% |
| Immigrants | Thailand | 97.0 /100 | #110 | Exceptional 6.9% |
Demographics Similar to Alsatians by 4 or more Vehicles in Household
In terms of 4 or more vehicles in household, the demographic groups most similar to Alsatians are Immigrants from Uruguay (5.4%, a difference of 0.010%), Immigrants from Western Africa (5.4%, a difference of 0.070%), Immigrants from Spain (5.4%, a difference of 0.24%), Immigrants from Ireland (5.4%, a difference of 0.32%), and Immigrants from Eastern Europe (5.4%, a difference of 0.47%).
| Demographics | Rating | Rank | 4 or more Vehicles in Household |
| Macedonians | 0.6 /100 | #273 | Tragic 5.5% |
| Blacks/African Americans | 0.6 /100 | #274 | Tragic 5.5% |
| Cambodians | 0.5 /100 | #275 | Tragic 5.5% |
| Immigrants | Latvia | 0.5 /100 | #276 | Tragic 5.5% |
| Immigrants | Bulgaria | 0.5 /100 | #277 | Tragic 5.5% |
| Immigrants | Eastern Europe | 0.4 /100 | #278 | Tragic 5.4% |
| Immigrants | Uruguay | 0.3 /100 | #279 | Tragic 5.4% |
| Alsatians | 0.3 /100 | #280 | Tragic 5.4% |
| Immigrants | Western Africa | 0.3 /100 | #281 | Tragic 5.4% |
| Immigrants | Spain | 0.3 /100 | #282 | Tragic 5.4% |
| Immigrants | Ireland | 0.3 /100 | #283 | Tragic 5.4% |
| Brazilians | 0.3 /100 | #284 | Tragic 5.4% |
| Immigrants | Liberia | 0.2 /100 | #285 | Tragic 5.4% |
| Immigrants | Colombia | 0.2 /100 | #286 | Tragic 5.4% |
| Immigrants | Croatia | 0.2 /100 | #287 | Tragic 5.4% |