Laotian vs Alsatian 4 or more Vehicles in Household
COMPARE
Laotian
Alsatian
4 or more Vehicles in Household
4 or more Vehicles in Household Comparison
Laotians
Alsatians
7.4%
4 OR MORE VEHICLES IN HOUSEHOLD
99.9/ 100
METRIC RATING
76th/ 347
METRIC RANK
5.4%
4 OR MORE VEHICLES IN HOUSEHOLD
0.3/ 100
METRIC RATING
280th/ 347
METRIC RANK
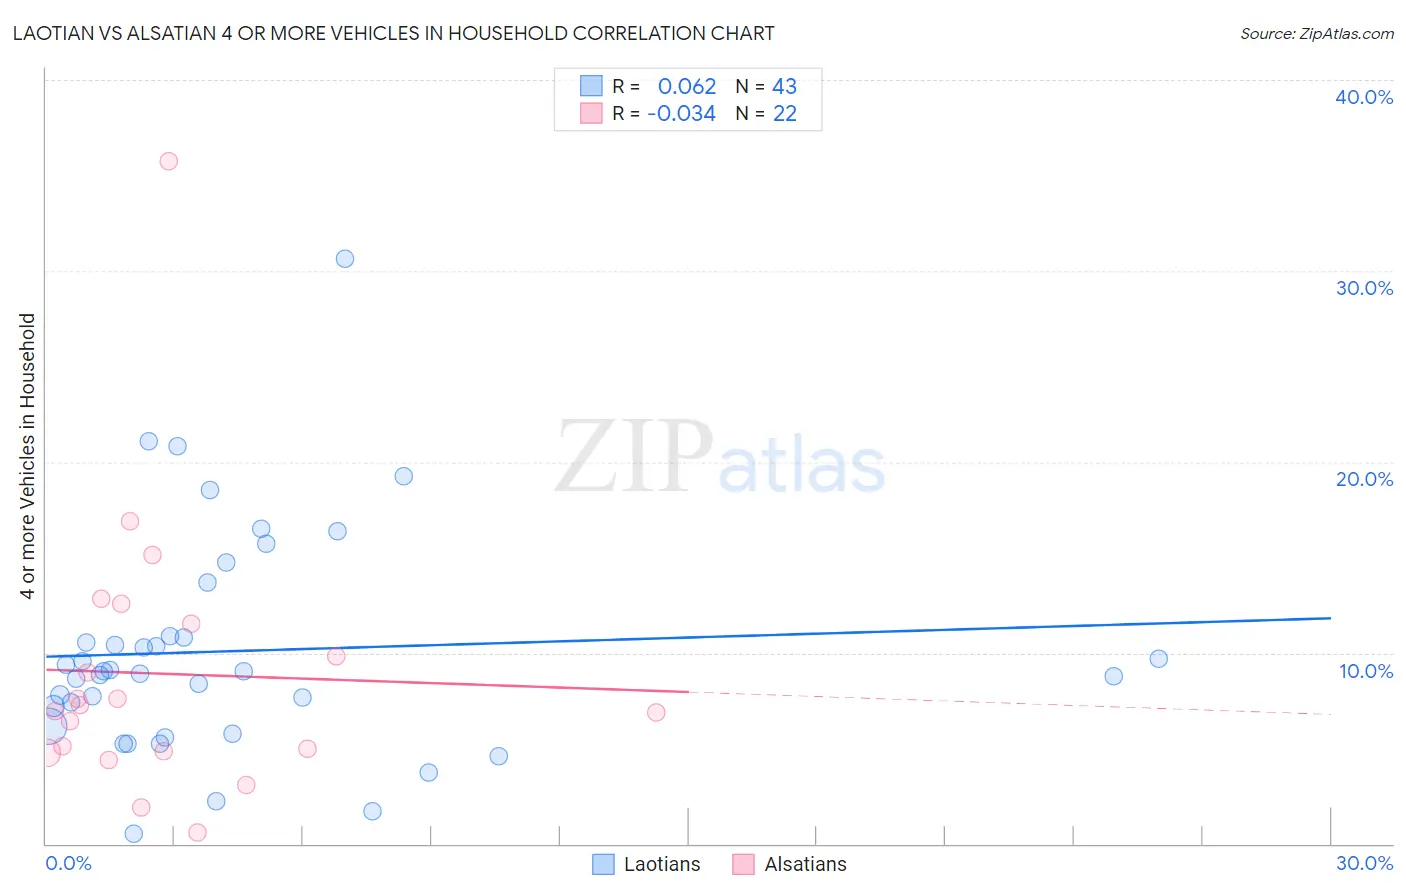
Laotian vs Alsatian 4 or more Vehicles in Household Correlation Chart
The statistical analysis conducted on geographies consisting of 224,004,331 people shows a slight positive correlation between the proportion of Laotians and percentage of households with 4 or more vehicles available in the United States with a correlation coefficient (R) of 0.062 and weighted average of 7.4%. Similarly, the statistical analysis conducted on geographies consisting of 82,502,049 people shows no correlation between the proportion of Alsatians and percentage of households with 4 or more vehicles available in the United States with a correlation coefficient (R) of -0.034 and weighted average of 5.4%, a difference of 36.5%.
4 or more Vehicles in Household Correlation Summary
| Measurement | Laotian | Alsatian |
| Minimum | 0.54% | 0.60% |
| Maximum | 30.6% | 35.7% |
| Range | 30.1% | 35.1% |
| Mean | 10.1% | 8.9% |
| Median | 9.0% | 7.1% |
| Interquartile 25% (IQ1) | 6.1% | 4.8% |
| Interquartile 75% (IQ3) | 10.8% | 11.5% |
| Interquartile Range (IQR) | 4.7% | 6.7% |
| Standard Deviation (Sample) | 5.8% | 7.3% |
| Standard Deviation (Population) | 5.8% | 7.1% |
Similar Demographics by 4 or more Vehicles in Household
Demographics Similar to Laotians by 4 or more Vehicles in Household
In terms of 4 or more vehicles in household, the demographic groups most similar to Laotians are Icelander (7.4%, a difference of 0.050%), Immigrants from Cambodia (7.4%, a difference of 0.050%), Apache (7.4%, a difference of 0.17%), White/Caucasian (7.4%, a difference of 0.23%), and Portuguese (7.4%, a difference of 0.36%).
| Demographics | Rating | Rank | 4 or more Vehicles in Household |
| Germans | 99.9 /100 | #69 | Exceptional 7.5% |
| Scottish | 99.9 /100 | #70 | Exceptional 7.4% |
| Chickasaw | 99.9 /100 | #71 | Exceptional 7.4% |
| Scotch-Irish | 99.9 /100 | #72 | Exceptional 7.4% |
| Portuguese | 99.9 /100 | #73 | Exceptional 7.4% |
| Icelanders | 99.9 /100 | #74 | Exceptional 7.4% |
| Immigrants | Cambodia | 99.9 /100 | #75 | Exceptional 7.4% |
| Laotians | 99.9 /100 | #76 | Exceptional 7.4% |
| Apache | 99.9 /100 | #77 | Exceptional 7.4% |
| Whites/Caucasians | 99.8 /100 | #78 | Exceptional 7.4% |
| Czechs | 99.8 /100 | #79 | Exceptional 7.4% |
| Alaska Natives | 99.8 /100 | #80 | Exceptional 7.3% |
| Finns | 99.8 /100 | #81 | Exceptional 7.3% |
| Northern Europeans | 99.8 /100 | #82 | Exceptional 7.3% |
| Potawatomi | 99.7 /100 | #83 | Exceptional 7.3% |
Demographics Similar to Alsatians by 4 or more Vehicles in Household
In terms of 4 or more vehicles in household, the demographic groups most similar to Alsatians are Immigrants from Uruguay (5.4%, a difference of 0.010%), Immigrants from Western Africa (5.4%, a difference of 0.070%), Immigrants from Spain (5.4%, a difference of 0.24%), Immigrants from Ireland (5.4%, a difference of 0.32%), and Immigrants from Eastern Europe (5.4%, a difference of 0.47%).
| Demographics | Rating | Rank | 4 or more Vehicles in Household |
| Macedonians | 0.6 /100 | #273 | Tragic 5.5% |
| Blacks/African Americans | 0.6 /100 | #274 | Tragic 5.5% |
| Cambodians | 0.5 /100 | #275 | Tragic 5.5% |
| Immigrants | Latvia | 0.5 /100 | #276 | Tragic 5.5% |
| Immigrants | Bulgaria | 0.5 /100 | #277 | Tragic 5.5% |
| Immigrants | Eastern Europe | 0.4 /100 | #278 | Tragic 5.4% |
| Immigrants | Uruguay | 0.3 /100 | #279 | Tragic 5.4% |
| Alsatians | 0.3 /100 | #280 | Tragic 5.4% |
| Immigrants | Western Africa | 0.3 /100 | #281 | Tragic 5.4% |
| Immigrants | Spain | 0.3 /100 | #282 | Tragic 5.4% |
| Immigrants | Ireland | 0.3 /100 | #283 | Tragic 5.4% |
| Brazilians | 0.3 /100 | #284 | Tragic 5.4% |
| Immigrants | Liberia | 0.2 /100 | #285 | Tragic 5.4% |
| Immigrants | Colombia | 0.2 /100 | #286 | Tragic 5.4% |
| Immigrants | Croatia | 0.2 /100 | #287 | Tragic 5.4% |