Blackfeet vs Mexican American Indian 4 or more Vehicles in Household
COMPARE
Blackfeet
Mexican American Indian
4 or more Vehicles in Household
4 or more Vehicles in Household Comparison
Blackfeet
Mexican American Indians
7.0%
4 OR MORE VEHICLES IN HOUSEHOLD
98.6/ 100
METRIC RATING
103rd/ 347
METRIC RANK
8.4%
4 OR MORE VEHICLES IN HOUSEHOLD
100.0/ 100
METRIC RATING
26th/ 347
METRIC RANK
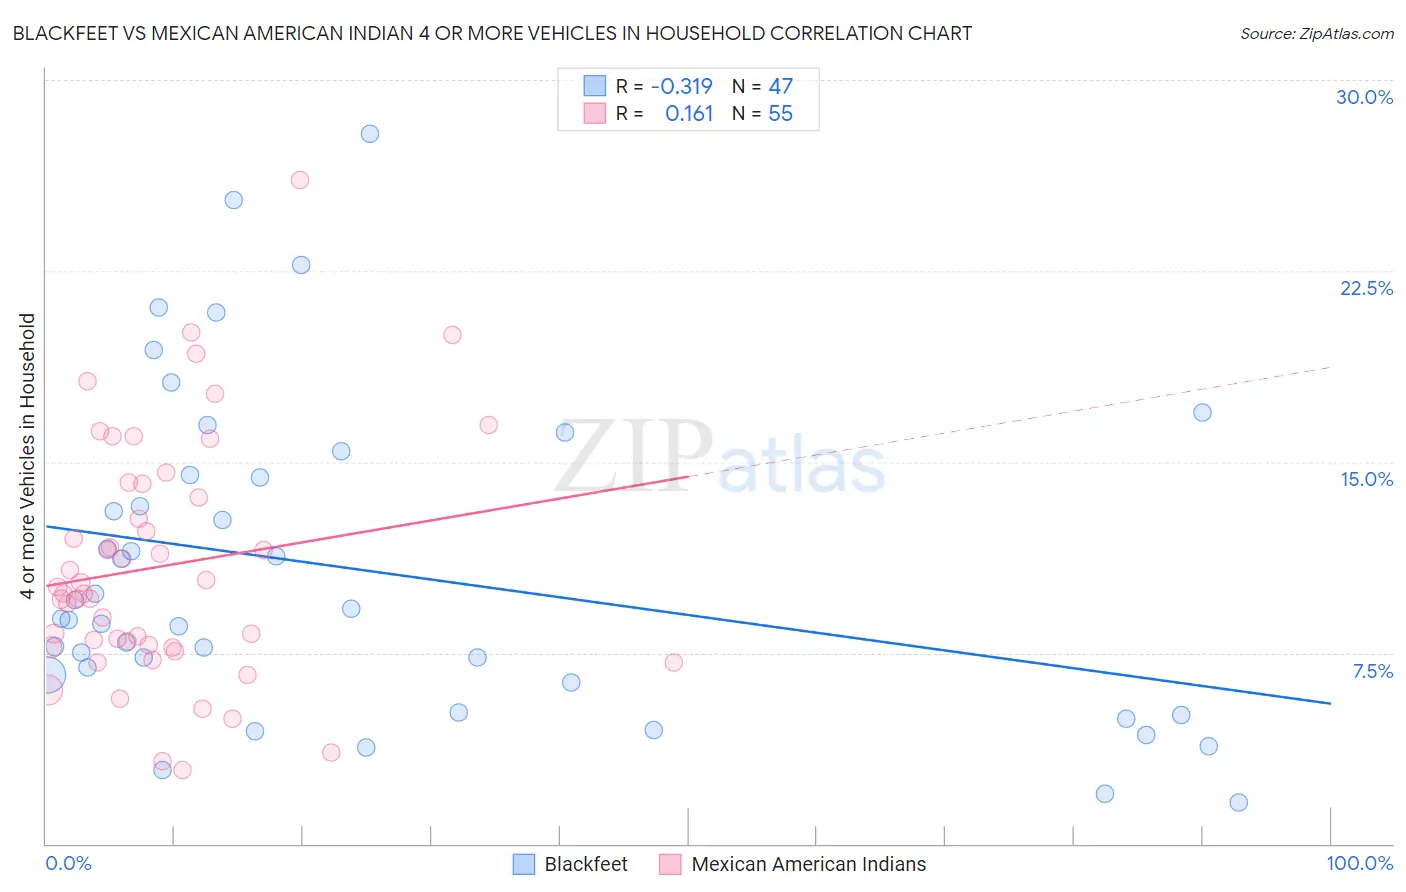
Blackfeet vs Mexican American Indian 4 or more Vehicles in Household Correlation Chart
The statistical analysis conducted on geographies consisting of 308,735,015 people shows a mild negative correlation between the proportion of Blackfeet and percentage of households with 4 or more vehicles available in the United States with a correlation coefficient (R) of -0.319 and weighted average of 7.0%. Similarly, the statistical analysis conducted on geographies consisting of 316,602,557 people shows a poor positive correlation between the proportion of Mexican American Indians and percentage of households with 4 or more vehicles available in the United States with a correlation coefficient (R) of 0.161 and weighted average of 8.4%, a difference of 19.9%.
4 or more Vehicles in Household Correlation Summary
| Measurement | Blackfeet | Mexican American Indian |
| Minimum | 1.6% | 2.9% |
| Maximum | 27.9% | 26.1% |
| Range | 26.3% | 23.2% |
| Mean | 10.7% | 10.9% |
| Median | 8.8% | 9.8% |
| Interquartile 25% (IQ1) | 6.3% | 7.7% |
| Interquartile 75% (IQ3) | 14.5% | 14.1% |
| Interquartile Range (IQR) | 8.2% | 6.4% |
| Standard Deviation (Sample) | 6.3% | 4.7% |
| Standard Deviation (Population) | 6.2% | 4.7% |
Similar Demographics by 4 or more Vehicles in Household
Demographics Similar to Blackfeet by 4 or more Vehicles in Household
In terms of 4 or more vehicles in household, the demographic groups most similar to Blackfeet are Asian (7.0%, a difference of 0.010%), Pakistani (7.0%, a difference of 0.080%), Taiwanese (7.0%, a difference of 0.15%), Seminole (7.0%, a difference of 0.22%), and Hmong (7.0%, a difference of 0.48%).
| Demographics | Rating | Rank | 4 or more Vehicles in Household |
| Central Americans | 99.3 /100 | #96 | Exceptional 7.1% |
| Celtics | 99.1 /100 | #97 | Exceptional 7.1% |
| Irish | 99.0 /100 | #98 | Exceptional 7.1% |
| Seminole | 98.8 /100 | #99 | Exceptional 7.0% |
| Taiwanese | 98.7 /100 | #100 | Exceptional 7.0% |
| Pakistanis | 98.7 /100 | #101 | Exceptional 7.0% |
| Asians | 98.6 /100 | #102 | Exceptional 7.0% |
| Blackfeet | 98.6 /100 | #103 | Exceptional 7.0% |
| Hmong | 98.3 /100 | #104 | Exceptional 7.0% |
| German Russians | 98.3 /100 | #105 | Exceptional 7.0% |
| Guatemalans | 98.1 /100 | #106 | Exceptional 7.0% |
| Nicaraguans | 98.0 /100 | #107 | Exceptional 7.0% |
| French | 97.7 /100 | #108 | Exceptional 6.9% |
| Filipinos | 97.6 /100 | #109 | Exceptional 6.9% |
| Immigrants | Thailand | 97.0 /100 | #110 | Exceptional 6.9% |
Demographics Similar to Mexican American Indians by 4 or more Vehicles in Household
In terms of 4 or more vehicles in household, the demographic groups most similar to Mexican American Indians are Sri Lankan (8.4%, a difference of 0.12%), Basque (8.4%, a difference of 0.31%), Immigrants from Central America (8.5%, a difference of 0.86%), Cheyenne (8.3%, a difference of 1.5%), and Immigrants from Philippines (8.5%, a difference of 1.7%).
| Demographics | Rating | Rank | 4 or more Vehicles in Household |
| Koreans | 100.0 /100 | #19 | Exceptional 8.6% |
| Pueblo | 100.0 /100 | #20 | Exceptional 8.6% |
| Danes | 100.0 /100 | #21 | Exceptional 8.6% |
| Immigrants | Vietnam | 100.0 /100 | #22 | Exceptional 8.6% |
| Immigrants | Philippines | 100.0 /100 | #23 | Exceptional 8.5% |
| Immigrants | Central America | 100.0 /100 | #24 | Exceptional 8.5% |
| Basques | 100.0 /100 | #25 | Exceptional 8.4% |
| Mexican American Indians | 100.0 /100 | #26 | Exceptional 8.4% |
| Sri Lankans | 100.0 /100 | #27 | Exceptional 8.4% |
| Cheyenne | 100.0 /100 | #28 | Exceptional 8.3% |
| Immigrants | South Eastern Asia | 100.0 /100 | #29 | Exceptional 8.2% |
| Navajo | 100.0 /100 | #30 | Exceptional 8.2% |
| Natives/Alaskans | 100.0 /100 | #31 | Exceptional 8.2% |
| Marshallese | 100.0 /100 | #32 | Exceptional 8.1% |
| Yaqui | 100.0 /100 | #33 | Exceptional 8.1% |