Bermudan vs Colville 4 or more Vehicles in Household
COMPARE
Bermudan
Colville
4 or more Vehicles in Household
4 or more Vehicles in Household Comparison
Bermudans
Colville
5.6%
4 OR MORE VEHICLES IN HOUSEHOLD
1.2/ 100
METRIC RATING
262nd/ 347
METRIC RANK
11.1%
4 OR MORE VEHICLES IN HOUSEHOLD
100.0/ 100
METRIC RATING
2nd/ 347
METRIC RANK
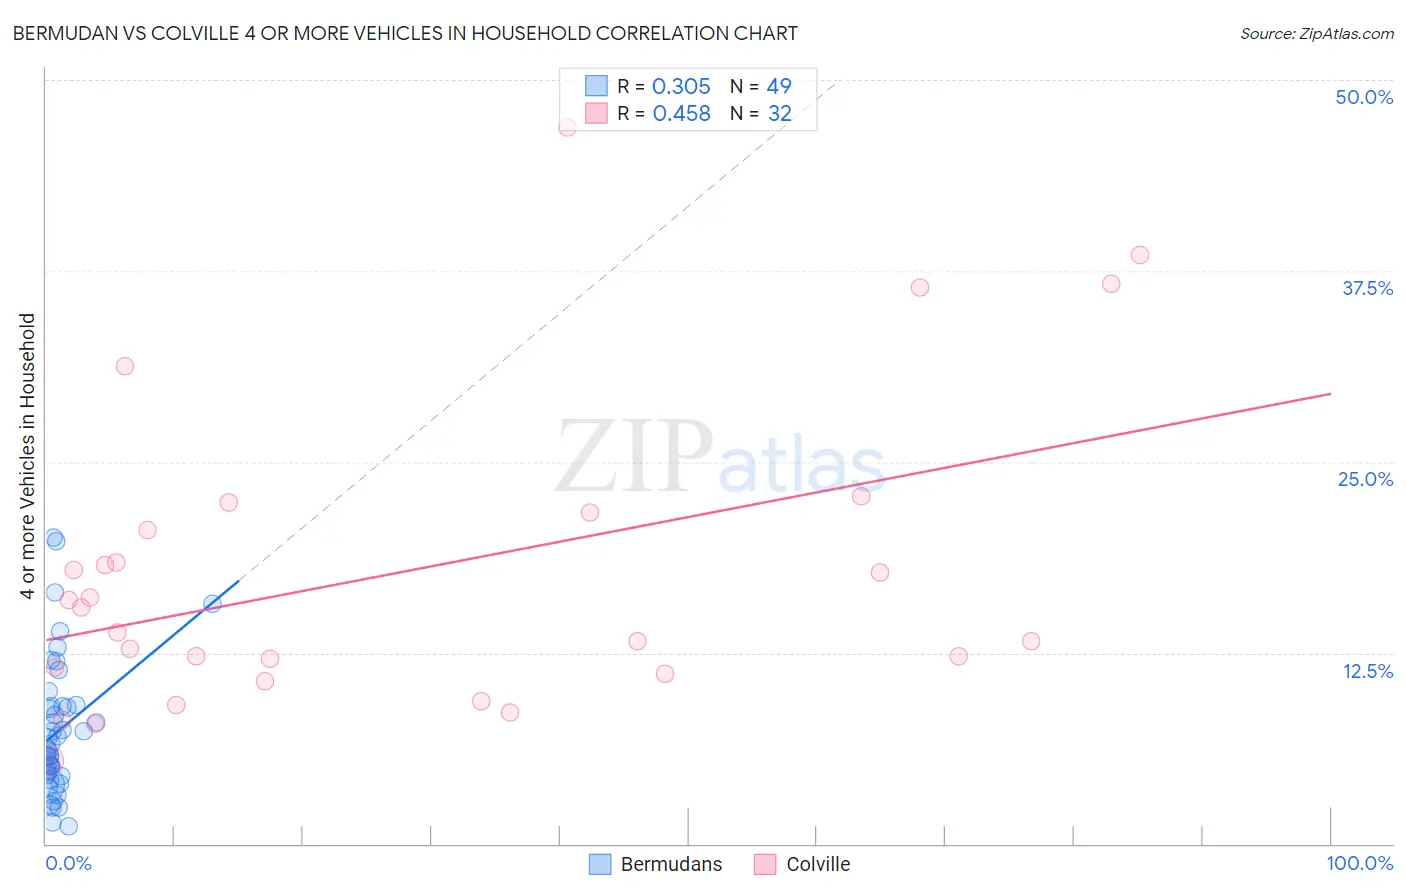
Bermudan vs Colville 4 or more Vehicles in Household Correlation Chart
The statistical analysis conducted on geographies consisting of 55,665,642 people shows a mild positive correlation between the proportion of Bermudans and percentage of households with 4 or more vehicles available in the United States with a correlation coefficient (R) of 0.305 and weighted average of 5.6%. Similarly, the statistical analysis conducted on geographies consisting of 34,672,098 people shows a moderate positive correlation between the proportion of Colville and percentage of households with 4 or more vehicles available in the United States with a correlation coefficient (R) of 0.458 and weighted average of 11.1%, a difference of 98.4%.
4 or more Vehicles in Household Correlation Summary
| Measurement | Bermudan | Colville |
| Minimum | 1.2% | 5.4% |
| Maximum | 20.0% | 46.9% |
| Range | 18.9% | 41.5% |
| Mean | 7.4% | 17.8% |
| Median | 6.2% | 14.6% |
| Interquartile 25% (IQ1) | 4.5% | 11.3% |
| Interquartile 75% (IQ3) | 9.0% | 21.1% |
| Interquartile Range (IQR) | 4.5% | 9.8% |
| Standard Deviation (Sample) | 4.4% | 10.0% |
| Standard Deviation (Population) | 4.3% | 9.9% |
Similar Demographics by 4 or more Vehicles in Household
Demographics Similar to Bermudans by 4 or more Vehicles in Household
In terms of 4 or more vehicles in household, the demographic groups most similar to Bermudans are Immigrants from Saudi Arabia (5.6%, a difference of 0.090%), Sudanese (5.6%, a difference of 0.11%), Uruguayan (5.6%, a difference of 0.20%), Immigrants from France (5.6%, a difference of 0.38%), and Immigrants from Lithuania (5.6%, a difference of 0.42%).
| Demographics | Rating | Rank | 4 or more Vehicles in Household |
| Yup'ik | 1.5 /100 | #255 | Tragic 5.7% |
| Immigrants | Turkey | 1.5 /100 | #256 | Tragic 5.7% |
| Immigrants | Northern Africa | 1.4 /100 | #257 | Tragic 5.6% |
| Immigrants | Lithuania | 1.4 /100 | #258 | Tragic 5.6% |
| Immigrants | France | 1.3 /100 | #259 | Tragic 5.6% |
| Uruguayans | 1.3 /100 | #260 | Tragic 5.6% |
| Sudanese | 1.2 /100 | #261 | Tragic 5.6% |
| Bermudans | 1.2 /100 | #262 | Tragic 5.6% |
| Immigrants | Saudi Arabia | 1.1 /100 | #263 | Tragic 5.6% |
| Immigrants | Africa | 1.0 /100 | #264 | Tragic 5.6% |
| South Americans | 0.9 /100 | #265 | Tragic 5.6% |
| Immigrants | Nepal | 0.9 /100 | #266 | Tragic 5.6% |
| Immigrants | Ukraine | 0.9 /100 | #267 | Tragic 5.6% |
| Colombians | 0.7 /100 | #268 | Tragic 5.5% |
| Carpatho Rusyns | 0.7 /100 | #269 | Tragic 5.5% |
Demographics Similar to Colville by 4 or more Vehicles in Household
In terms of 4 or more vehicles in household, the demographic groups most similar to Colville are Spanish American Indian (10.8%, a difference of 3.5%), Tongan (10.0%, a difference of 11.0%), Immigrants from Fiji (9.6%, a difference of 15.8%), Yakama (12.9%, a difference of 16.1%), and Puget Sound Salish (9.4%, a difference of 18.7%).
| Demographics | Rating | Rank | 4 or more Vehicles in Household |
| Yakama | 100 /100 | #1 | Exceptional 12.9% |
| Colville | 100.0 /100 | #2 | Exceptional 11.1% |
| Spanish American Indians | 100.0 /100 | #3 | Exceptional 10.8% |
| Tongans | 100.0 /100 | #4 | Exceptional 10.0% |
| Immigrants | Fiji | 100.0 /100 | #5 | Exceptional 9.6% |
| Puget Sound Salish | 100.0 /100 | #6 | Exceptional 9.4% |
| Native Hawaiians | 100.0 /100 | #7 | Exceptional 9.4% |
| Arapaho | 100.0 /100 | #8 | Exceptional 9.4% |
| Samoans | 100.0 /100 | #9 | Exceptional 9.2% |
| Paiute | 100.0 /100 | #10 | Exceptional 9.0% |
| Immigrants | Mexico | 100.0 /100 | #11 | Exceptional 9.0% |
| Mexicans | 100.0 /100 | #12 | Exceptional 8.9% |
| Hawaiians | 100.0 /100 | #13 | Exceptional 8.9% |
| Chinese | 100.0 /100 | #14 | Exceptional 8.8% |
| Shoshone | 100.0 /100 | #15 | Exceptional 8.8% |