Bermudan vs Immigrants from Ghana 4 or more Vehicles in Household
COMPARE
Bermudan
Immigrants from Ghana
4 or more Vehicles in Household
4 or more Vehicles in Household Comparison
Bermudans
Immigrants from Ghana
5.6%
4 OR MORE VEHICLES IN HOUSEHOLD
1.2/ 100
METRIC RATING
262nd/ 347
METRIC RANK
5.2%
4 OR MORE VEHICLES IN HOUSEHOLD
0.1/ 100
METRIC RATING
299th/ 347
METRIC RANK
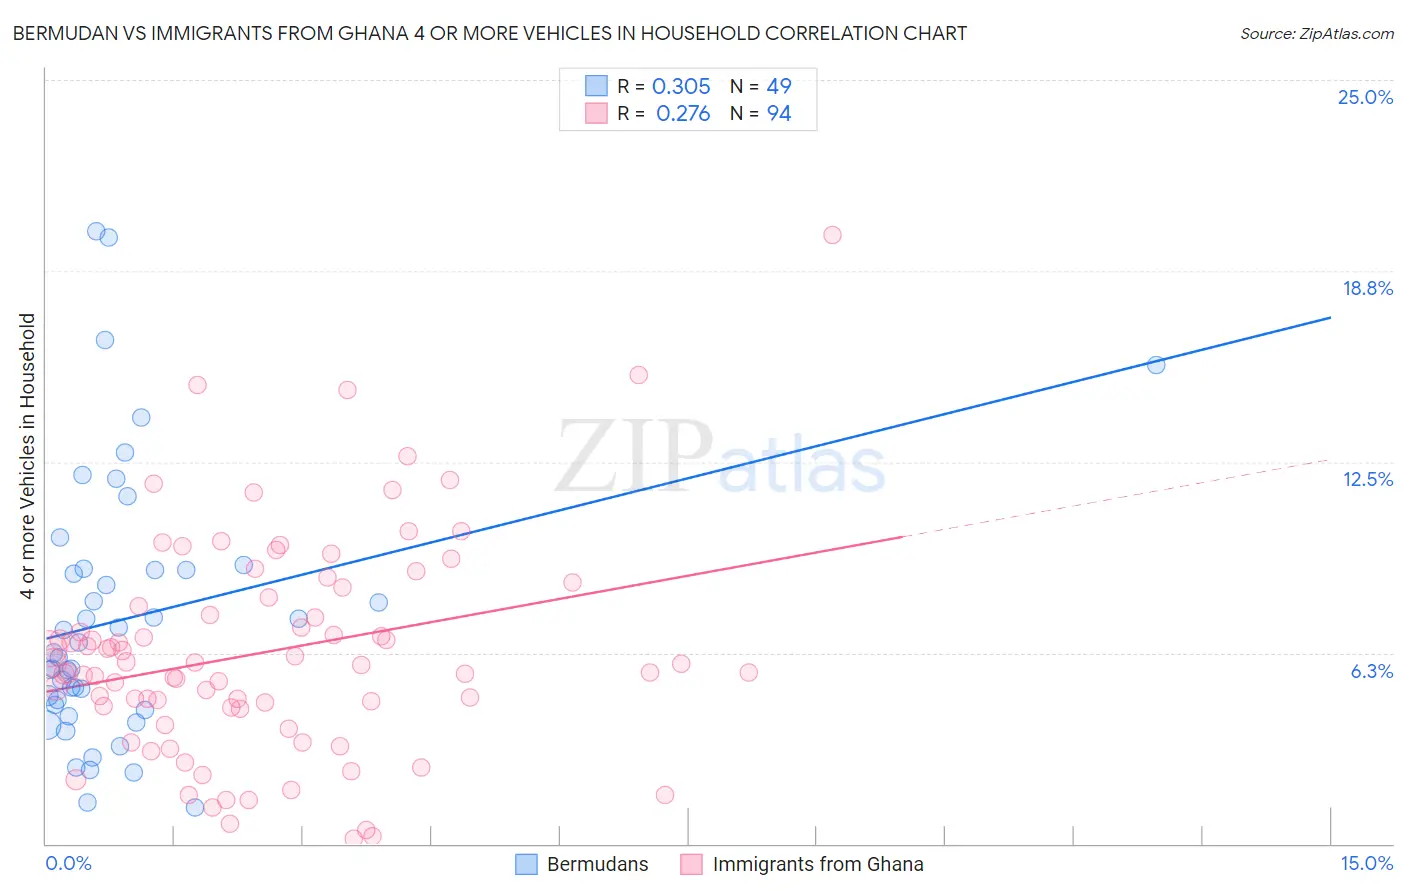
Bermudan vs Immigrants from Ghana 4 or more Vehicles in Household Correlation Chart
The statistical analysis conducted on geographies consisting of 55,665,642 people shows a mild positive correlation between the proportion of Bermudans and percentage of households with 4 or more vehicles available in the United States with a correlation coefficient (R) of 0.305 and weighted average of 5.6%. Similarly, the statistical analysis conducted on geographies consisting of 198,971,687 people shows a weak positive correlation between the proportion of Immigrants from Ghana and percentage of households with 4 or more vehicles available in the United States with a correlation coefficient (R) of 0.276 and weighted average of 5.2%, a difference of 8.5%.
4 or more Vehicles in Household Correlation Summary
| Measurement | Bermudan | Immigrants from Ghana |
| Minimum | 1.2% | 0.17% |
| Maximum | 20.0% | 19.9% |
| Range | 18.9% | 19.8% |
| Mean | 7.4% | 6.3% |
| Median | 6.2% | 5.9% |
| Interquartile 25% (IQ1) | 4.5% | 4.4% |
| Interquartile 75% (IQ3) | 9.0% | 8.1% |
| Interquartile Range (IQR) | 4.5% | 3.6% |
| Standard Deviation (Sample) | 4.4% | 3.6% |
| Standard Deviation (Population) | 4.3% | 3.5% |
Similar Demographics by 4 or more Vehicles in Household
Demographics Similar to Bermudans by 4 or more Vehicles in Household
In terms of 4 or more vehicles in household, the demographic groups most similar to Bermudans are Immigrants from Saudi Arabia (5.6%, a difference of 0.090%), Sudanese (5.6%, a difference of 0.11%), Uruguayan (5.6%, a difference of 0.20%), Immigrants from France (5.6%, a difference of 0.38%), and Immigrants from Lithuania (5.6%, a difference of 0.42%).
| Demographics | Rating | Rank | 4 or more Vehicles in Household |
| Yup'ik | 1.5 /100 | #255 | Tragic 5.7% |
| Immigrants | Turkey | 1.5 /100 | #256 | Tragic 5.7% |
| Immigrants | Northern Africa | 1.4 /100 | #257 | Tragic 5.6% |
| Immigrants | Lithuania | 1.4 /100 | #258 | Tragic 5.6% |
| Immigrants | France | 1.3 /100 | #259 | Tragic 5.6% |
| Uruguayans | 1.3 /100 | #260 | Tragic 5.6% |
| Sudanese | 1.2 /100 | #261 | Tragic 5.6% |
| Bermudans | 1.2 /100 | #262 | Tragic 5.6% |
| Immigrants | Saudi Arabia | 1.1 /100 | #263 | Tragic 5.6% |
| Immigrants | Africa | 1.0 /100 | #264 | Tragic 5.6% |
| South Americans | 0.9 /100 | #265 | Tragic 5.6% |
| Immigrants | Nepal | 0.9 /100 | #266 | Tragic 5.6% |
| Immigrants | Ukraine | 0.9 /100 | #267 | Tragic 5.6% |
| Colombians | 0.7 /100 | #268 | Tragic 5.5% |
| Carpatho Rusyns | 0.7 /100 | #269 | Tragic 5.5% |
Demographics Similar to Immigrants from Ghana by 4 or more Vehicles in Household
In terms of 4 or more vehicles in household, the demographic groups most similar to Immigrants from Ghana are Immigrants from South America (5.2%, a difference of 0.46%), Immigrants from Venezuela (5.2%, a difference of 0.79%), Israeli (5.2%, a difference of 1.1%), Immigrants from Brazil (5.2%, a difference of 1.3%), and Ghanaian (5.2%, a difference of 1.4%).
| Demographics | Rating | Rank | 4 or more Vehicles in Household |
| Liberians | 0.1 /100 | #292 | Tragic 5.3% |
| Immigrants | Congo | 0.1 /100 | #293 | Tragic 5.2% |
| Ghanaians | 0.1 /100 | #294 | Tragic 5.2% |
| Immigrants | Brazil | 0.1 /100 | #295 | Tragic 5.2% |
| Israelis | 0.1 /100 | #296 | Tragic 5.2% |
| Immigrants | Venezuela | 0.1 /100 | #297 | Tragic 5.2% |
| Immigrants | South America | 0.1 /100 | #298 | Tragic 5.2% |
| Immigrants | Ghana | 0.1 /100 | #299 | Tragic 5.2% |
| Immigrants | Morocco | 0.0 /100 | #300 | Tragic 5.1% |
| Immigrants | Zaire | 0.0 /100 | #301 | Tragic 5.1% |
| Bahamians | 0.0 /100 | #302 | Tragic 5.1% |
| Immigrants | Greece | 0.0 /100 | #303 | Tragic 5.1% |
| Cypriots | 0.0 /100 | #304 | Tragic 5.0% |
| Somalis | 0.0 /100 | #305 | Tragic 5.0% |
| Immigrants | Serbia | 0.0 /100 | #306 | Tragic 5.0% |