Belizean vs Immigrants from Ecuador Associate's Degree
COMPARE
Belizean
Immigrants from Ecuador
Associate's Degree
Associate's Degree Comparison
Belizeans
Immigrants from Ecuador
40.6%
ASSOCIATE'S DEGREE
0.1/ 100
METRIC RATING
272nd/ 347
METRIC RANK
42.2%
ASSOCIATE'S DEGREE
0.8/ 100
METRIC RATING
248th/ 347
METRIC RANK
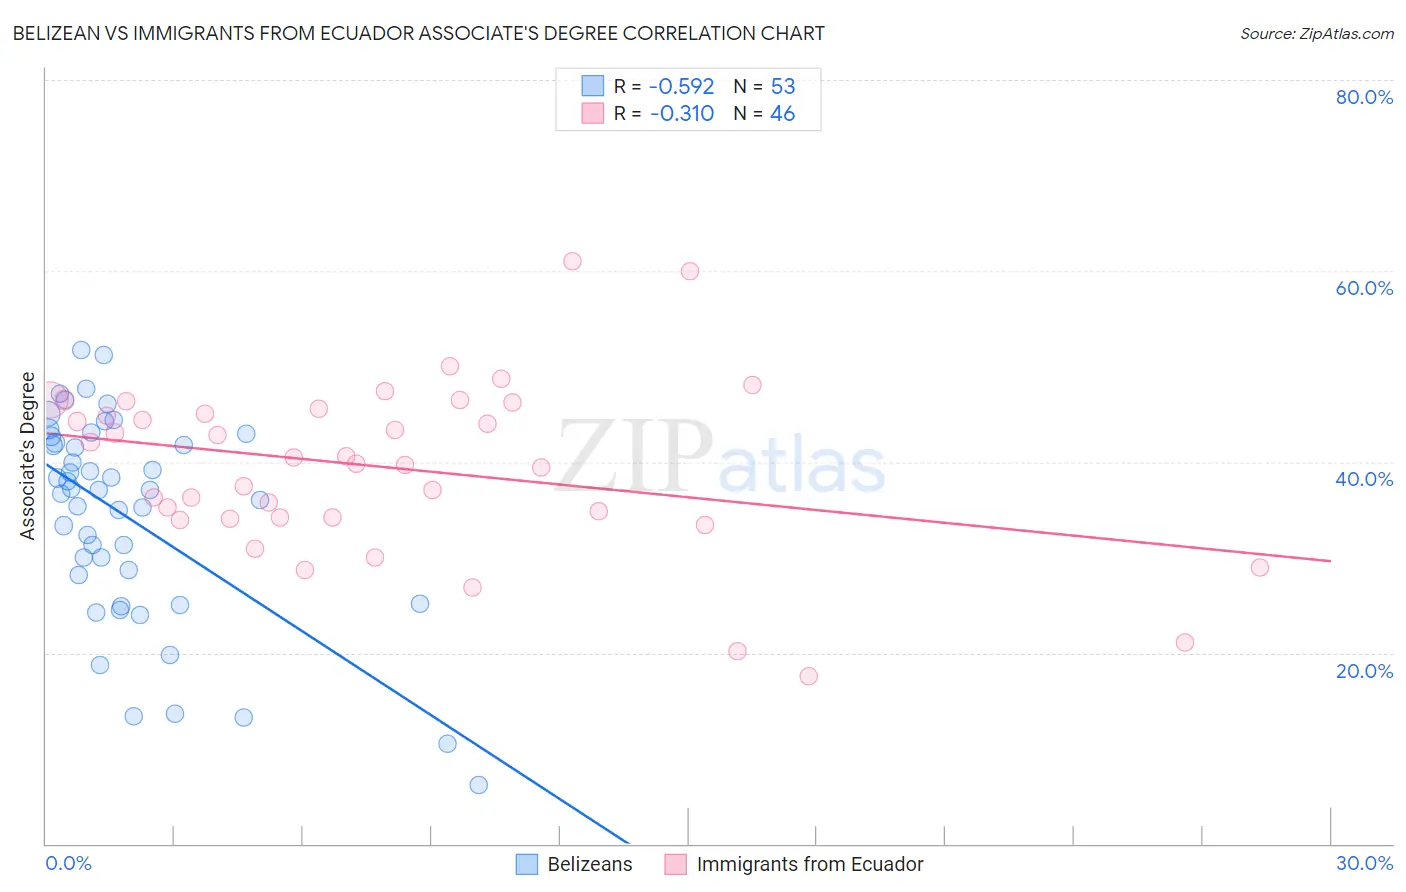
Belizean vs Immigrants from Ecuador Associate's Degree Correlation Chart
The statistical analysis conducted on geographies consisting of 144,216,581 people shows a substantial negative correlation between the proportion of Belizeans and percentage of population with at least associate's degree education in the United States with a correlation coefficient (R) of -0.592 and weighted average of 40.6%. Similarly, the statistical analysis conducted on geographies consisting of 271,013,289 people shows a mild negative correlation between the proportion of Immigrants from Ecuador and percentage of population with at least associate's degree education in the United States with a correlation coefficient (R) of -0.310 and weighted average of 42.2%, a difference of 3.8%.
Associate's Degree Correlation Summary
| Measurement | Belizean | Immigrants from Ecuador |
| Minimum | 6.2% | 17.6% |
| Maximum | 51.7% | 61.0% |
| Range | 45.5% | 43.4% |
| Mean | 34.2% | 39.4% |
| Median | 37.0% | 40.1% |
| Interquartile 25% (IQ1) | 26.6% | 34.2% |
| Interquartile 75% (IQ3) | 42.4% | 45.6% |
| Interquartile Range (IQR) | 15.7% | 11.4% |
| Standard Deviation (Sample) | 10.8% | 9.0% |
| Standard Deviation (Population) | 10.7% | 8.9% |
Similar Demographics by Associate's Degree
Demographics Similar to Belizeans by Associate's Degree
In terms of associate's degree, the demographic groups most similar to Belizeans are Immigrants from Laos (40.7%, a difference of 0.070%), Chippewa (40.7%, a difference of 0.25%), Puget Sound Salish (40.5%, a difference of 0.29%), American (40.8%, a difference of 0.30%), and Immigrants from Dominica (40.5%, a difference of 0.43%).
| Demographics | Rating | Rank | Associate's Degree |
| Africans | 0.2 /100 | #265 | Tragic 41.1% |
| Samoans | 0.2 /100 | #266 | Tragic 41.1% |
| Hawaiians | 0.2 /100 | #267 | Tragic 40.9% |
| Central American Indians | 0.2 /100 | #268 | Tragic 40.8% |
| Americans | 0.2 /100 | #269 | Tragic 40.8% |
| Chippewa | 0.2 /100 | #270 | Tragic 40.7% |
| Immigrants | Laos | 0.1 /100 | #271 | Tragic 40.7% |
| Belizeans | 0.1 /100 | #272 | Tragic 40.6% |
| Puget Sound Salish | 0.1 /100 | #273 | Tragic 40.5% |
| Immigrants | Dominica | 0.1 /100 | #274 | Tragic 40.5% |
| Potawatomi | 0.1 /100 | #275 | Tragic 40.4% |
| Puerto Ricans | 0.1 /100 | #276 | Tragic 40.4% |
| Blackfeet | 0.1 /100 | #277 | Tragic 40.3% |
| Ottawa | 0.1 /100 | #278 | Tragic 40.3% |
| Immigrants | Nicaragua | 0.1 /100 | #279 | Tragic 40.3% |
Demographics Similar to Immigrants from Ecuador by Associate's Degree
In terms of associate's degree, the demographic groups most similar to Immigrants from Ecuador are Immigrants from Fiji (42.2%, a difference of 0.090%), Jamaican (42.1%, a difference of 0.14%), U.S. Virgin Islander (42.1%, a difference of 0.16%), Delaware (42.3%, a difference of 0.18%), and Immigrants from Bahamas (42.1%, a difference of 0.18%).
| Demographics | Rating | Rank | Associate's Degree |
| British West Indians | 1.0 /100 | #241 | Tragic 42.4% |
| Immigrants | West Indies | 1.0 /100 | #242 | Tragic 42.4% |
| Guyanese | 1.0 /100 | #243 | Tragic 42.3% |
| Immigrants | Liberia | 0.9 /100 | #244 | Tragic 42.3% |
| Immigrants | Cambodia | 0.9 /100 | #245 | Tragic 42.3% |
| Delaware | 0.9 /100 | #246 | Tragic 42.3% |
| Immigrants | Fiji | 0.8 /100 | #247 | Tragic 42.2% |
| Immigrants | Ecuador | 0.8 /100 | #248 | Tragic 42.2% |
| Jamaicans | 0.7 /100 | #249 | Tragic 42.1% |
| U.S. Virgin Islanders | 0.7 /100 | #250 | Tragic 42.1% |
| Immigrants | Bahamas | 0.7 /100 | #251 | Tragic 42.1% |
| French American Indians | 0.6 /100 | #252 | Tragic 42.0% |
| Indonesians | 0.6 /100 | #253 | Tragic 41.9% |
| Cubans | 0.6 /100 | #254 | Tragic 41.9% |
| Immigrants | Guyana | 0.5 /100 | #255 | Tragic 41.8% |