Belizean vs Egyptian 2 or more Vehicles in Household
COMPARE
Belizean
Egyptian
2 or more Vehicles in Household
2 or more Vehicles in Household Comparison
Belizeans
Egyptians
51.0%
2 OR MORE VEHICLES IN HOUSEHOLD
0.0/ 100
METRIC RATING
291st/ 347
METRIC RANK
54.3%
2 OR MORE VEHICLES IN HOUSEHOLD
12.0/ 100
METRIC RATING
208th/ 347
METRIC RANK
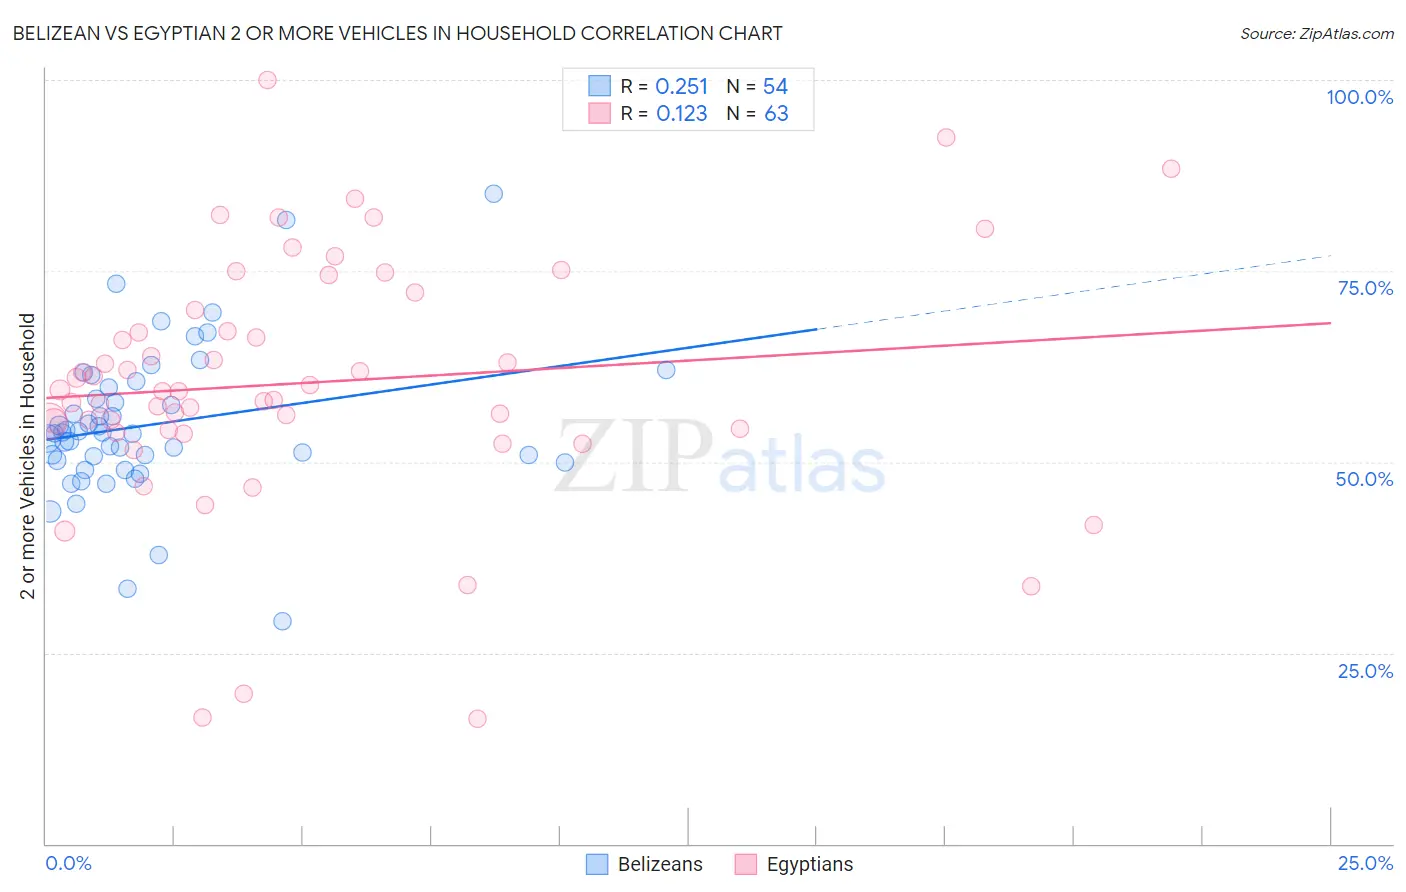
Belizean vs Egyptian 2 or more Vehicles in Household Correlation Chart
The statistical analysis conducted on geographies consisting of 144,162,212 people shows a weak positive correlation between the proportion of Belizeans and percentage of households with 2 or more vehicles available in the United States with a correlation coefficient (R) of 0.251 and weighted average of 51.0%. Similarly, the statistical analysis conducted on geographies consisting of 276,797,335 people shows a poor positive correlation between the proportion of Egyptians and percentage of households with 2 or more vehicles available in the United States with a correlation coefficient (R) of 0.123 and weighted average of 54.3%, a difference of 6.3%.
2 or more Vehicles in Household Correlation Summary
| Measurement | Belizean | Egyptian |
| Minimum | 29.2% | 16.3% |
| Maximum | 85.1% | 100.0% |
| Range | 55.9% | 83.7% |
| Mean | 54.9% | 60.4% |
| Median | 53.8% | 59.3% |
| Interquartile 25% (IQ1) | 50.2% | 54.2% |
| Interquartile 75% (IQ3) | 59.7% | 69.9% |
| Interquartile Range (IQR) | 9.5% | 15.6% |
| Standard Deviation (Sample) | 9.9% | 16.3% |
| Standard Deviation (Population) | 9.8% | 16.2% |
Similar Demographics by 2 or more Vehicles in Household
Demographics Similar to Belizeans by 2 or more Vehicles in Household
In terms of 2 or more vehicles in household, the demographic groups most similar to Belizeans are Immigrants from Panama (51.1%, a difference of 0.030%), Somali (51.1%, a difference of 0.10%), Immigrants from Ukraine (50.9%, a difference of 0.33%), Black/African American (50.9%, a difference of 0.33%), and Okinawan (51.2%, a difference of 0.38%).
| Demographics | Rating | Rank | 2 or more Vehicles in Household |
| Immigrants | Zaire | 0.1 /100 | #284 | Tragic 51.5% |
| Immigrants | Uruguay | 0.1 /100 | #285 | Tragic 51.4% |
| Immigrants | Liberia | 0.1 /100 | #286 | Tragic 51.3% |
| Immigrants | Serbia | 0.1 /100 | #287 | Tragic 51.3% |
| Okinawans | 0.1 /100 | #288 | Tragic 51.2% |
| Somalis | 0.0 /100 | #289 | Tragic 51.1% |
| Immigrants | Panama | 0.0 /100 | #290 | Tragic 51.1% |
| Belizeans | 0.0 /100 | #291 | Tragic 51.0% |
| Immigrants | Ukraine | 0.0 /100 | #292 | Tragic 50.9% |
| Blacks/African Americans | 0.0 /100 | #293 | Tragic 50.9% |
| Bermudans | 0.0 /100 | #294 | Tragic 50.6% |
| Cypriots | 0.0 /100 | #295 | Tragic 50.6% |
| Immigrants | Somalia | 0.0 /100 | #296 | Tragic 50.5% |
| Immigrants | Spain | 0.0 /100 | #297 | Tragic 50.4% |
| Paraguayans | 0.0 /100 | #298 | Tragic 50.3% |
Demographics Similar to Egyptians by 2 or more Vehicles in Household
In terms of 2 or more vehicles in household, the demographic groups most similar to Egyptians are Immigrants from Bulgaria (54.3%, a difference of 0.0%), Immigrants from Saudi Arabia (54.2%, a difference of 0.060%), Immigrants from Hungary (54.2%, a difference of 0.070%), Turkish (54.3%, a difference of 0.090%), and Immigrants from Chile (54.2%, a difference of 0.090%).
| Demographics | Rating | Rank | 2 or more Vehicles in Household |
| Immigrants | Italy | 15.5 /100 | #201 | Poor 54.4% |
| Immigrants | North Macedonia | 14.9 /100 | #202 | Poor 54.4% |
| Immigrants | Peru | 14.3 /100 | #203 | Poor 54.4% |
| Immigrants | Belgium | 13.7 /100 | #204 | Poor 54.3% |
| Cheyenne | 13.6 /100 | #205 | Poor 54.3% |
| Immigrants | Latin America | 13.1 /100 | #206 | Poor 54.3% |
| Turks | 13.0 /100 | #207 | Poor 54.3% |
| Egyptians | 12.0 /100 | #208 | Poor 54.3% |
| Immigrants | Bulgaria | 12.0 /100 | #209 | Poor 54.3% |
| Immigrants | Saudi Arabia | 11.3 /100 | #210 | Poor 54.2% |
| Immigrants | Hungary | 11.3 /100 | #211 | Poor 54.2% |
| Immigrants | Chile | 11.1 /100 | #212 | Poor 54.2% |
| Guatemalans | 9.6 /100 | #213 | Tragic 54.1% |
| Immigrants | Czechoslovakia | 9.4 /100 | #214 | Tragic 54.1% |
| Aleuts | 9.3 /100 | #215 | Tragic 54.1% |