Austrian vs Indonesian No Vehicles in Household
COMPARE
Austrian
Indonesian
No Vehicles in Household
No Vehicles in Household Comparison
Austrians
Indonesians
8.8%
NO VEHICLES IN HOUSEHOLD
98.9/ 100
METRIC RATING
94th/ 347
METRIC RANK
10.3%
NO VEHICLES IN HOUSEHOLD
56.7/ 100
METRIC RATING
168th/ 347
METRIC RANK
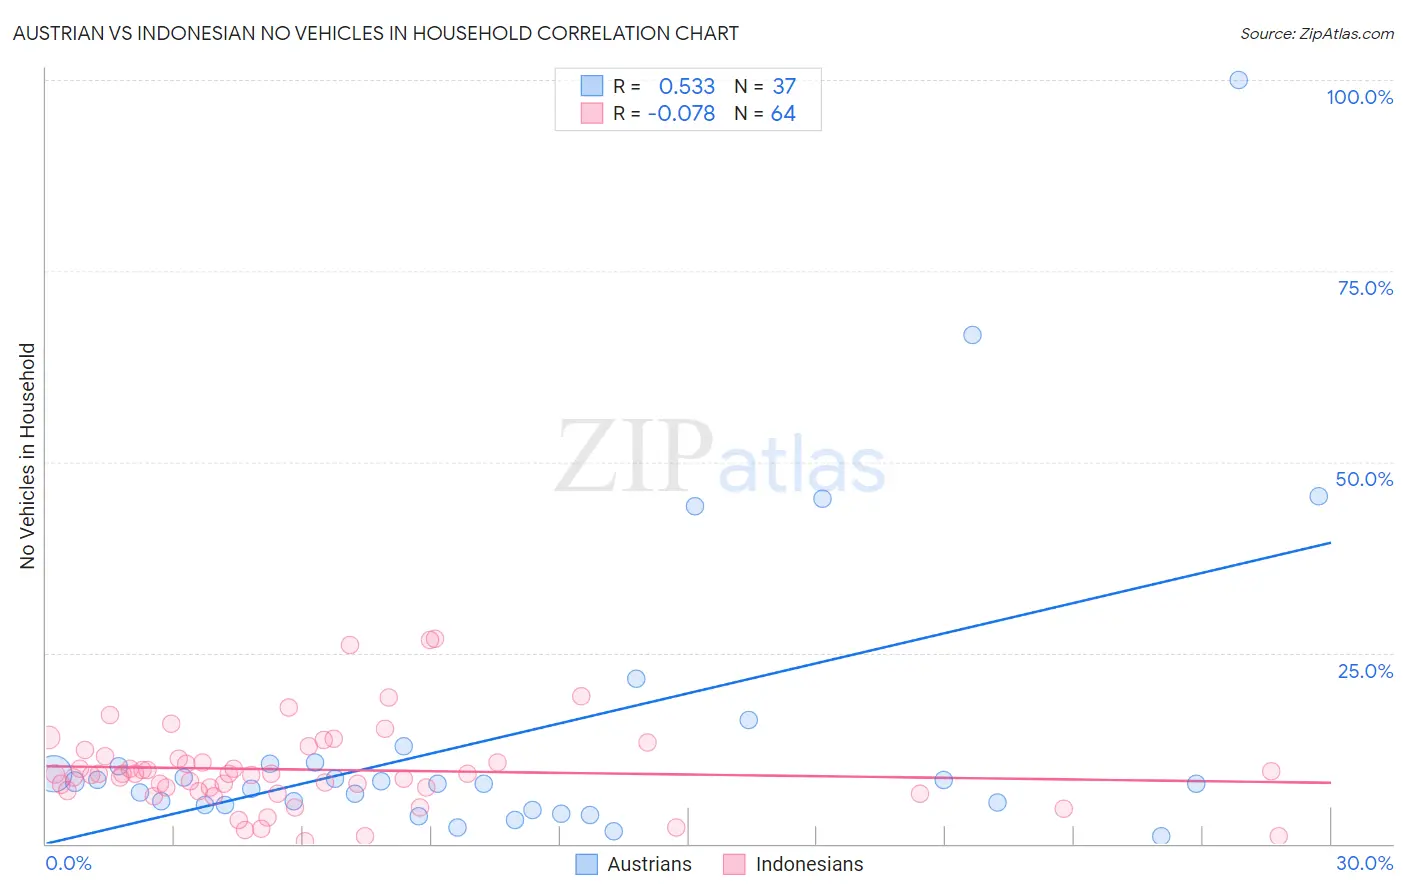
Austrian vs Indonesian No Vehicles in Household Correlation Chart
The statistical analysis conducted on geographies consisting of 450,345,618 people shows a substantial positive correlation between the proportion of Austrians and percentage of households with no vehicle available in the United States with a correlation coefficient (R) of 0.533 and weighted average of 8.8%. Similarly, the statistical analysis conducted on geographies consisting of 162,572,047 people shows a slight negative correlation between the proportion of Indonesians and percentage of households with no vehicle available in the United States with a correlation coefficient (R) of -0.078 and weighted average of 10.3%, a difference of 16.8%.
No Vehicles in Household Correlation Summary
| Measurement | Austrian | Indonesian |
| Minimum | 0.94% | 0.37% |
| Maximum | 100.0% | 26.9% |
| Range | 99.1% | 26.5% |
| Mean | 14.5% | 9.7% |
| Median | 7.9% | 9.1% |
| Interquartile 25% (IQ1) | 5.1% | 7.0% |
| Interquartile 75% (IQ3) | 10.5% | 11.3% |
| Interquartile Range (IQR) | 5.4% | 4.3% |
| Standard Deviation (Sample) | 20.4% | 5.6% |
| Standard Deviation (Population) | 20.1% | 5.6% |
Similar Demographics by No Vehicles in Household
Demographics Similar to Austrians by No Vehicles in Household
In terms of no vehicles in household, the demographic groups most similar to Austrians are Potawatomi (8.8%, a difference of 0.14%), Immigrants from Bolivia (8.9%, a difference of 0.43%), Immigrants from North America (8.7%, a difference of 0.95%), Immigrants from Central America (8.9%, a difference of 1.1%), and Immigrants from Canada (8.7%, a difference of 1.1%).
| Demographics | Rating | Rank | No Vehicles in Household |
| Immigrants | England | 99.2 /100 | #87 | Exceptional 8.7% |
| Osage | 99.2 /100 | #88 | Exceptional 8.7% |
| Immigrants | Cuba | 99.2 /100 | #89 | Exceptional 8.7% |
| Bhutanese | 99.2 /100 | #90 | Exceptional 8.7% |
| Immigrants | Germany | 99.1 /100 | #91 | Exceptional 8.7% |
| Immigrants | Canada | 99.1 /100 | #92 | Exceptional 8.7% |
| Immigrants | North America | 99.1 /100 | #93 | Exceptional 8.7% |
| Austrians | 98.9 /100 | #94 | Exceptional 8.8% |
| Potawatomi | 98.8 /100 | #95 | Exceptional 8.8% |
| Immigrants | Bolivia | 98.7 /100 | #96 | Exceptional 8.9% |
| Immigrants | Central America | 98.5 /100 | #97 | Exceptional 8.9% |
| Slavs | 98.4 /100 | #98 | Exceptional 9.0% |
| Bulgarians | 98.4 /100 | #99 | Exceptional 9.0% |
| Asians | 98.3 /100 | #100 | Exceptional 9.0% |
| Pakistanis | 98.3 /100 | #101 | Exceptional 9.0% |
Demographics Similar to Indonesians by No Vehicles in Household
In terms of no vehicles in household, the demographic groups most similar to Indonesians are Lumbee (10.3%, a difference of 0.27%), Immigrants from Saudi Arabia (10.3%, a difference of 0.29%), Immigrants from Latin America (10.4%, a difference of 0.48%), Immigrants from Costa Rica (10.3%, a difference of 0.54%), and Hmong (10.4%, a difference of 0.55%).
| Demographics | Rating | Rank | No Vehicles in Household |
| New Zealanders | 65.1 /100 | #161 | Good 10.2% |
| Immigrants | Austria | 64.4 /100 | #162 | Good 10.2% |
| Immigrants | Cambodia | 63.7 /100 | #163 | Good 10.2% |
| South Africans | 61.1 /100 | #164 | Good 10.2% |
| Comanche | 60.8 /100 | #165 | Good 10.2% |
| Immigrants | Costa Rica | 60.5 /100 | #166 | Good 10.3% |
| Immigrants | Saudi Arabia | 58.8 /100 | #167 | Average 10.3% |
| Indonesians | 56.7 /100 | #168 | Average 10.3% |
| Lumbee | 54.7 /100 | #169 | Average 10.3% |
| Immigrants | Latin America | 53.2 /100 | #170 | Average 10.4% |
| Hmong | 52.7 /100 | #171 | Average 10.4% |
| Brazilians | 51.7 /100 | #172 | Average 10.4% |
| Filipinos | 50.1 /100 | #173 | Average 10.4% |
| Immigrants | Sudan | 50.0 /100 | #174 | Average 10.4% |
| Immigrants | Burma/Myanmar | 49.1 /100 | #175 | Average 10.4% |