South African vs Israeli No Vehicles in Household
COMPARE
South African
Israeli
No Vehicles in Household
No Vehicles in Household Comparison
South Africans
Israelis
10.2%
NO VEHICLES IN HOUSEHOLD
61.1/ 100
METRIC RATING
164th/ 347
METRIC RANK
12.4%
NO VEHICLES IN HOUSEHOLD
0.3/ 100
METRIC RATING
266th/ 347
METRIC RANK
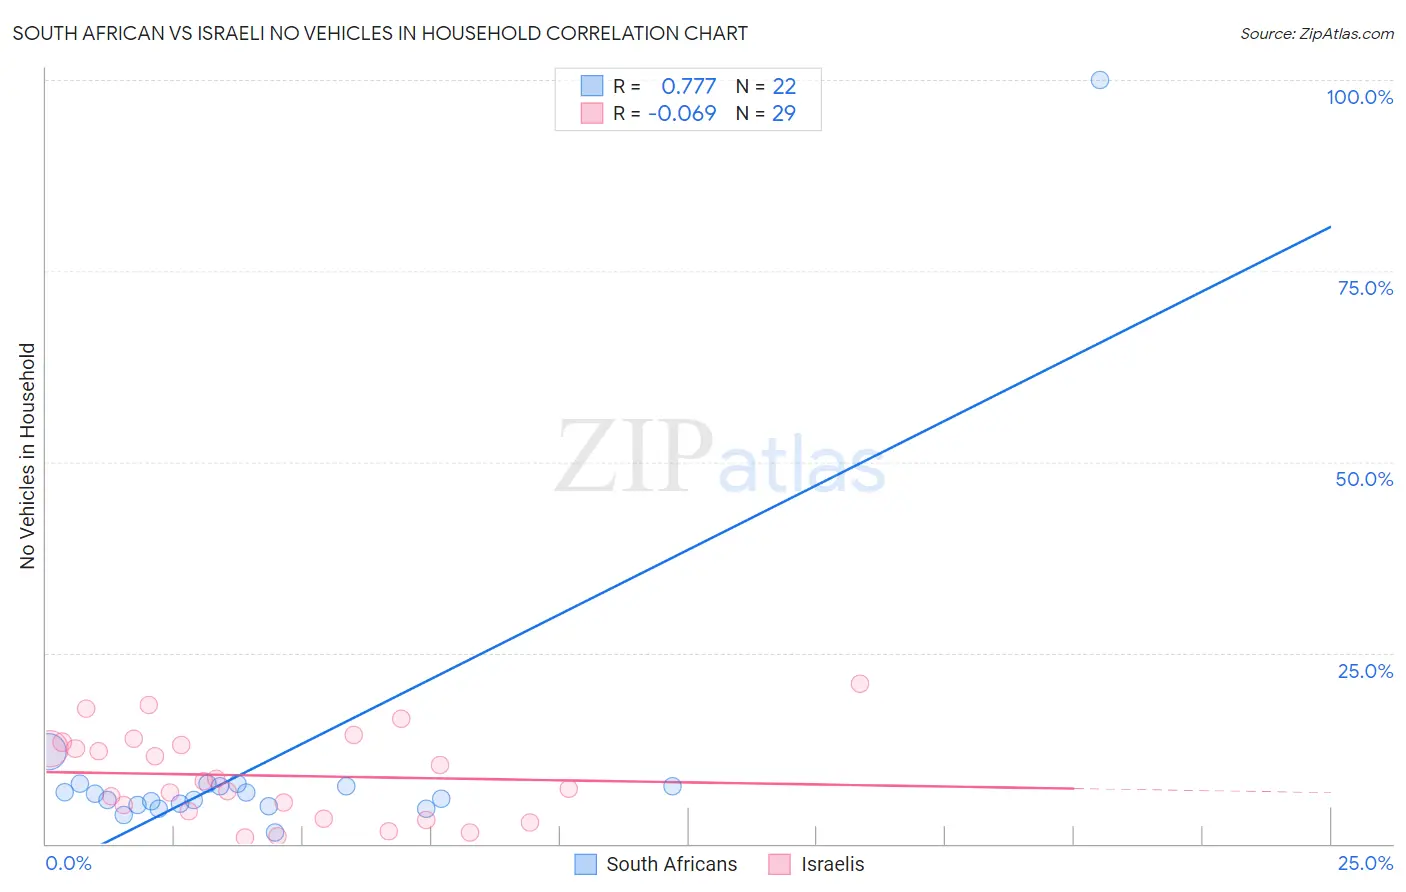
South African vs Israeli No Vehicles in Household Correlation Chart
The statistical analysis conducted on geographies consisting of 182,340,903 people shows a strong positive correlation between the proportion of South Africans and percentage of households with no vehicle available in the United States with a correlation coefficient (R) of 0.777 and weighted average of 10.2%. Similarly, the statistical analysis conducted on geographies consisting of 210,769,657 people shows a slight negative correlation between the proportion of Israelis and percentage of households with no vehicle available in the United States with a correlation coefficient (R) of -0.069 and weighted average of 12.4%, a difference of 21.4%.
No Vehicles in Household Correlation Summary
| Measurement | South African | Israeli |
| Minimum | 1.5% | 0.80% |
| Maximum | 100.0% | 20.9% |
| Range | 98.5% | 20.1% |
| Mean | 10.5% | 8.9% |
| Median | 6.2% | 8.2% |
| Interquartile 25% (IQ1) | 5.1% | 3.8% |
| Interquartile 75% (IQ3) | 7.6% | 13.1% |
| Interquartile Range (IQR) | 2.5% | 9.3% |
| Standard Deviation (Sample) | 20.1% | 5.7% |
| Standard Deviation (Population) | 19.6% | 5.6% |
Similar Demographics by No Vehicles in Household
Demographics Similar to South Africans by No Vehicles in Household
In terms of no vehicles in household, the demographic groups most similar to South Africans are Comanche (10.2%, a difference of 0.040%), Immigrants from Costa Rica (10.3%, a difference of 0.10%), Immigrants from Saudi Arabia (10.3%, a difference of 0.34%), Immigrants from Cambodia (10.2%, a difference of 0.37%), and Immigrants from Austria (10.2%, a difference of 0.48%).
| Demographics | Rating | Rank | No Vehicles in Household |
| Australians | 70.6 /100 | #157 | Good 10.1% |
| Spanish American Indians | 70.2 /100 | #158 | Good 10.1% |
| Immigrants | Indonesia | 69.3 /100 | #159 | Good 10.1% |
| Immigrants | Middle Africa | 65.7 /100 | #160 | Good 10.2% |
| New Zealanders | 65.1 /100 | #161 | Good 10.2% |
| Immigrants | Austria | 64.4 /100 | #162 | Good 10.2% |
| Immigrants | Cambodia | 63.7 /100 | #163 | Good 10.2% |
| South Africans | 61.1 /100 | #164 | Good 10.2% |
| Comanche | 60.8 /100 | #165 | Good 10.2% |
| Immigrants | Costa Rica | 60.5 /100 | #166 | Good 10.3% |
| Immigrants | Saudi Arabia | 58.8 /100 | #167 | Average 10.3% |
| Indonesians | 56.7 /100 | #168 | Average 10.3% |
| Lumbee | 54.7 /100 | #169 | Average 10.3% |
| Immigrants | Latin America | 53.2 /100 | #170 | Average 10.4% |
| Hmong | 52.7 /100 | #171 | Average 10.4% |
Demographics Similar to Israelis by No Vehicles in Household
In terms of no vehicles in household, the demographic groups most similar to Israelis are Immigrants from Europe (12.5%, a difference of 0.58%), Immigrants from Africa (12.5%, a difference of 0.63%), Panamanian (12.5%, a difference of 0.76%), African (12.3%, a difference of 0.96%), and Immigrants from Switzerland (12.3%, a difference of 1.2%).
| Demographics | Rating | Rank | No Vehicles in Household |
| Immigrants | Latvia | 0.8 /100 | #259 | Tragic 12.1% |
| Macedonians | 0.7 /100 | #260 | Tragic 12.2% |
| Sub-Saharan Africans | 0.6 /100 | #261 | Tragic 12.2% |
| Immigrants | Liberia | 0.6 /100 | #262 | Tragic 12.2% |
| Immigrants | Egypt | 0.6 /100 | #263 | Tragic 12.2% |
| Immigrants | Switzerland | 0.5 /100 | #264 | Tragic 12.3% |
| Africans | 0.4 /100 | #265 | Tragic 12.3% |
| Israelis | 0.3 /100 | #266 | Tragic 12.4% |
| Immigrants | Europe | 0.3 /100 | #267 | Tragic 12.5% |
| Immigrants | Africa | 0.2 /100 | #268 | Tragic 12.5% |
| Panamanians | 0.2 /100 | #269 | Tragic 12.5% |
| Immigrants | Northern Africa | 0.2 /100 | #270 | Tragic 12.6% |
| Immigrants | Morocco | 0.2 /100 | #271 | Tragic 12.6% |
| Bermudans | 0.1 /100 | #272 | Tragic 12.8% |
| Immigrants | France | 0.1 /100 | #273 | Tragic 12.9% |