Korean vs Israeli No Vehicles in Household
COMPARE
Korean
Israeli
No Vehicles in Household
No Vehicles in Household Comparison
Koreans
Israelis
8.0%
NO VEHICLES IN HOUSEHOLD
99.9/ 100
METRIC RATING
51st/ 347
METRIC RANK
12.4%
NO VEHICLES IN HOUSEHOLD
0.3/ 100
METRIC RATING
266th/ 347
METRIC RANK
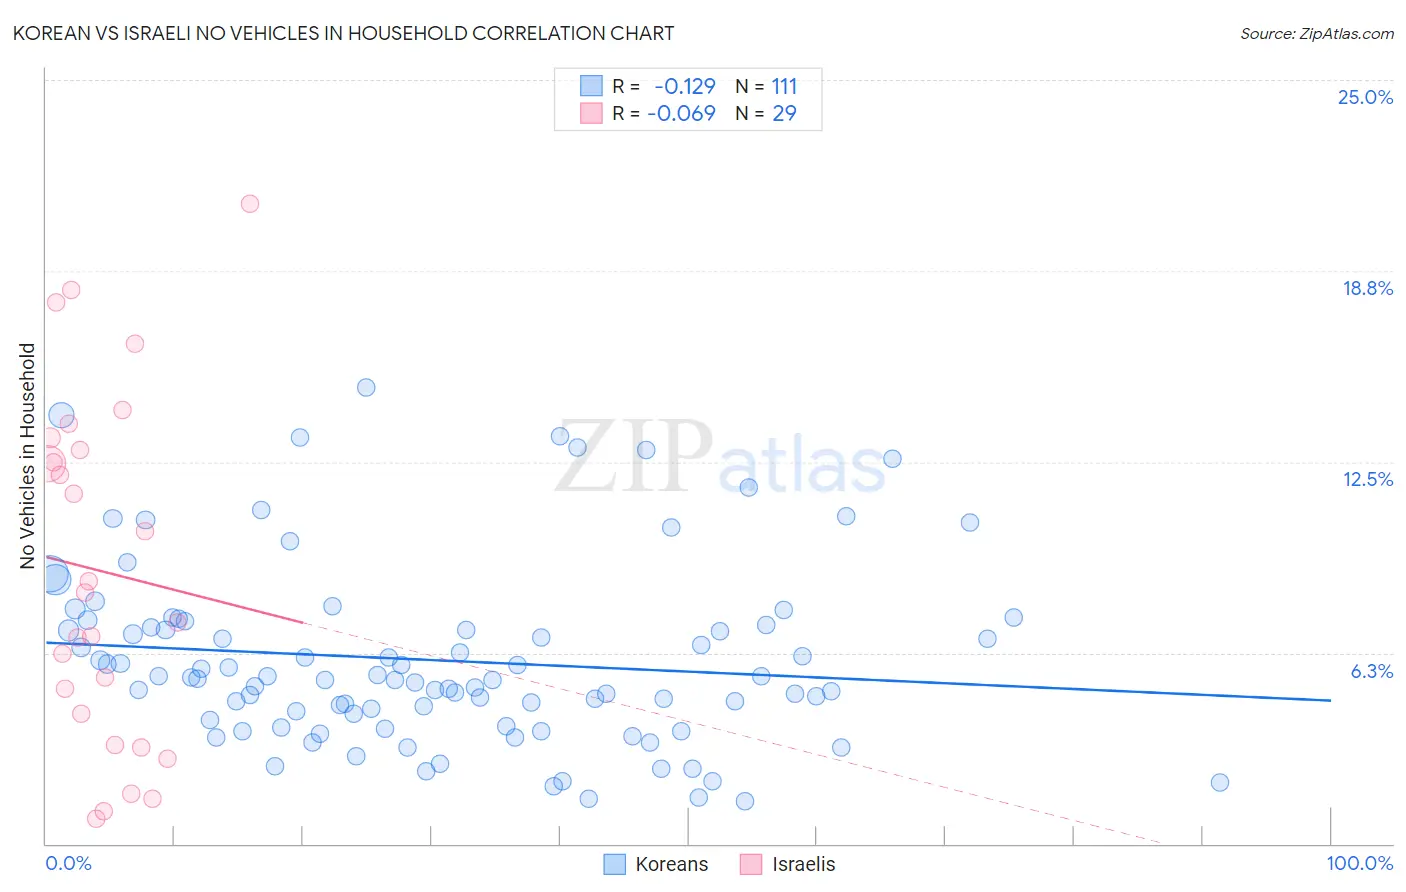
Korean vs Israeli No Vehicles in Household Correlation Chart
The statistical analysis conducted on geographies consisting of 508,454,508 people shows a poor negative correlation between the proportion of Koreans and percentage of households with no vehicle available in the United States with a correlation coefficient (R) of -0.129 and weighted average of 8.0%. Similarly, the statistical analysis conducted on geographies consisting of 210,769,657 people shows a slight negative correlation between the proportion of Israelis and percentage of households with no vehicle available in the United States with a correlation coefficient (R) of -0.069 and weighted average of 12.4%, a difference of 55.6%.
No Vehicles in Household Correlation Summary
| Measurement | Korean | Israeli |
| Minimum | 1.4% | 0.80% |
| Maximum | 14.9% | 20.9% |
| Range | 13.6% | 20.1% |
| Mean | 6.0% | 8.9% |
| Median | 5.4% | 8.2% |
| Interquartile 25% (IQ1) | 4.1% | 3.8% |
| Interquartile 75% (IQ3) | 7.2% | 13.1% |
| Interquartile Range (IQR) | 3.1% | 9.3% |
| Standard Deviation (Sample) | 2.9% | 5.7% |
| Standard Deviation (Population) | 2.9% | 5.6% |
Similar Demographics by No Vehicles in Household
Demographics Similar to Koreans by No Vehicles in Household
In terms of no vehicles in household, the demographic groups most similar to Koreans are Belgian (8.0%, a difference of 0.10%), Guamanian/Chamorro (8.0%, a difference of 0.17%), Afghan (8.0%, a difference of 0.34%), Hawaiian (8.0%, a difference of 0.58%), and Slovene (8.0%, a difference of 0.58%).
| Demographics | Rating | Rank | No Vehicles in Household |
| Choctaw | 99.9 /100 | #44 | Exceptional 7.9% |
| Immigrants | Nonimmigrants | 99.9 /100 | #45 | Exceptional 7.9% |
| Spanish | 99.9 /100 | #46 | Exceptional 7.9% |
| Northern Europeans | 99.9 /100 | #47 | Exceptional 7.9% |
| Afghans | 99.9 /100 | #48 | Exceptional 8.0% |
| Guamanians/Chamorros | 99.9 /100 | #49 | Exceptional 8.0% |
| Belgians | 99.9 /100 | #50 | Exceptional 8.0% |
| Koreans | 99.9 /100 | #51 | Exceptional 8.0% |
| Hawaiians | 99.9 /100 | #52 | Exceptional 8.0% |
| Slovenes | 99.9 /100 | #53 | Exceptional 8.0% |
| Immigrants | Venezuela | 99.9 /100 | #54 | Exceptional 8.1% |
| Celtics | 99.9 /100 | #55 | Exceptional 8.1% |
| Immigrants | Afghanistan | 99.9 /100 | #56 | Exceptional 8.1% |
| Venezuelans | 99.8 /100 | #57 | Exceptional 8.1% |
| Immigrants | Mexico | 99.8 /100 | #58 | Exceptional 8.1% |
Demographics Similar to Israelis by No Vehicles in Household
In terms of no vehicles in household, the demographic groups most similar to Israelis are Immigrants from Europe (12.5%, a difference of 0.58%), Immigrants from Africa (12.5%, a difference of 0.63%), Panamanian (12.5%, a difference of 0.76%), African (12.3%, a difference of 0.96%), and Immigrants from Switzerland (12.3%, a difference of 1.2%).
| Demographics | Rating | Rank | No Vehicles in Household |
| Immigrants | Latvia | 0.8 /100 | #259 | Tragic 12.1% |
| Macedonians | 0.7 /100 | #260 | Tragic 12.2% |
| Sub-Saharan Africans | 0.6 /100 | #261 | Tragic 12.2% |
| Immigrants | Liberia | 0.6 /100 | #262 | Tragic 12.2% |
| Immigrants | Egypt | 0.6 /100 | #263 | Tragic 12.2% |
| Immigrants | Switzerland | 0.5 /100 | #264 | Tragic 12.3% |
| Africans | 0.4 /100 | #265 | Tragic 12.3% |
| Israelis | 0.3 /100 | #266 | Tragic 12.4% |
| Immigrants | Europe | 0.3 /100 | #267 | Tragic 12.5% |
| Immigrants | Africa | 0.2 /100 | #268 | Tragic 12.5% |
| Panamanians | 0.2 /100 | #269 | Tragic 12.5% |
| Immigrants | Northern Africa | 0.2 /100 | #270 | Tragic 12.6% |
| Immigrants | Morocco | 0.2 /100 | #271 | Tragic 12.6% |
| Bermudans | 0.1 /100 | #272 | Tragic 12.8% |
| Immigrants | France | 0.1 /100 | #273 | Tragic 12.9% |