Asian vs Latvian Median Family Income
COMPARE
Asian
Latvian
Median Family Income
Median Family Income Comparison
Asians
Latvians
$119,955
MEDIAN FAMILY INCOME
100.0/ 100
METRIC RATING
32nd/ 347
METRIC RANK
$120,301
MEDIAN FAMILY INCOME
100.0/ 100
METRIC RATING
29th/ 347
METRIC RANK
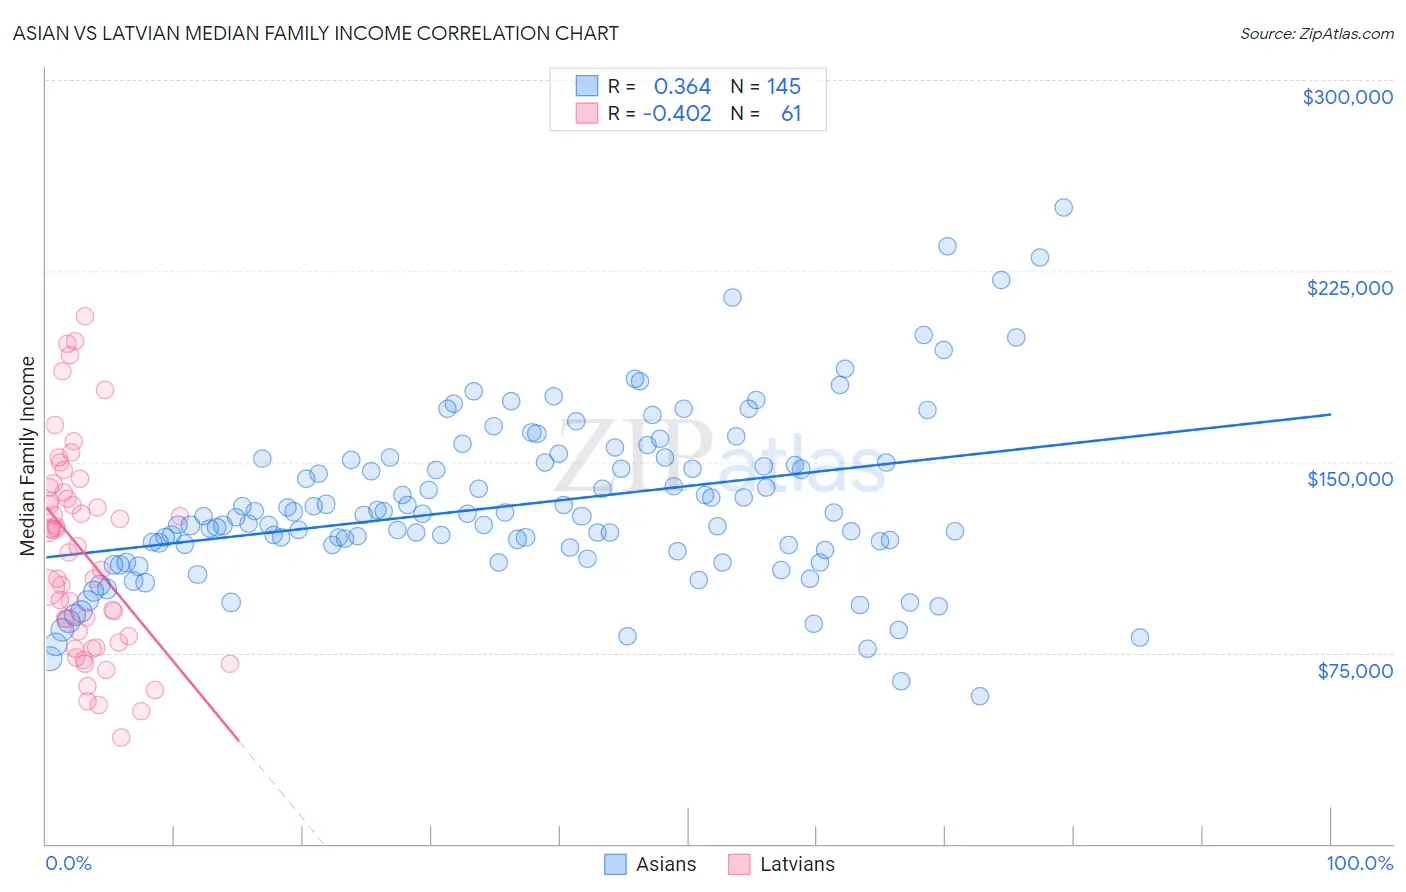
Asian vs Latvian Median Family Income Correlation Chart
The statistical analysis conducted on geographies consisting of 549,758,807 people shows a mild positive correlation between the proportion of Asians and median family income in the United States with a correlation coefficient (R) of 0.364 and weighted average of $119,955. Similarly, the statistical analysis conducted on geographies consisting of 220,626,536 people shows a moderate negative correlation between the proportion of Latvians and median family income in the United States with a correlation coefficient (R) of -0.402 and weighted average of $120,301, a difference of 0.29%.
Median Family Income Correlation Summary
| Measurement | Asian | Latvian |
| Minimum | $58,163 | $41,641 |
| Maximum | $250,001 | $207,328 |
| Range | $191,838 | $165,687 |
| Mean | $133,077 | $114,631 |
| Median | $128,500 | $116,635 |
| Interquartile 25% (IQ1) | $115,250 | $80,254 |
| Interquartile 75% (IQ3) | $150,323 | $139,118 |
| Interquartile Range (IQR) | $35,073 | $58,864 |
| Standard Deviation (Sample) | $33,384 | $40,043 |
| Standard Deviation (Population) | $33,269 | $39,714 |
Demographics Similar to Asians and Latvians by Median Family Income
In terms of median family income, the demographic groups most similar to Asians are Immigrants from France ($120,076, a difference of 0.10%), Bhutanese ($119,800, a difference of 0.13%), Immigrants from Sri Lanka ($120,263, a difference of 0.26%), Bolivian ($119,479, a difference of 0.40%), and Immigrants from Denmark ($120,445, a difference of 0.41%). Similarly, the demographic groups most similar to Latvians are Immigrants from Sri Lanka ($120,263, a difference of 0.030%), Immigrants from Denmark ($120,445, a difference of 0.12%), Russian ($120,487, a difference of 0.15%), Immigrants from France ($120,076, a difference of 0.19%), and Immigrants from Switzerland ($120,726, a difference of 0.35%).
| Demographics | Rating | Rank | Median Family Income |
| Burmese | 100.0 /100 | #20 | Exceptional $123,369 |
| Immigrants | Korea | 100.0 /100 | #21 | Exceptional $122,800 |
| Immigrants | Sweden | 100.0 /100 | #22 | Exceptional $122,765 |
| Immigrants | Japan | 100.0 /100 | #23 | Exceptional $122,764 |
| Immigrants | Northern Europe | 100.0 /100 | #24 | Exceptional $121,840 |
| Turks | 100.0 /100 | #25 | Exceptional $121,202 |
| Immigrants | Switzerland | 100.0 /100 | #26 | Exceptional $120,726 |
| Russians | 100.0 /100 | #27 | Exceptional $120,487 |
| Immigrants | Denmark | 100.0 /100 | #28 | Exceptional $120,445 |
| Latvians | 100.0 /100 | #29 | Exceptional $120,301 |
| Immigrants | Sri Lanka | 100.0 /100 | #30 | Exceptional $120,263 |
| Immigrants | France | 100.0 /100 | #31 | Exceptional $120,076 |
| Asians | 100.0 /100 | #32 | Exceptional $119,955 |
| Bhutanese | 100.0 /100 | #33 | Exceptional $119,800 |
| Bolivians | 100.0 /100 | #34 | Exceptional $119,479 |
| Soviet Union | 100.0 /100 | #35 | Exceptional $119,262 |
| Israelis | 100.0 /100 | #36 | Exceptional $118,577 |
| Australians | 100.0 /100 | #37 | Exceptional $118,440 |
| Immigrants | Turkey | 100.0 /100 | #38 | Exceptional $118,325 |
| Immigrants | Asia | 100.0 /100 | #39 | Exceptional $118,291 |
| Immigrants | Lithuania | 100.0 /100 | #40 | Exceptional $118,053 |