Asian vs Menominee 4 or more Vehicles in Household
COMPARE
Asian
Menominee
4 or more Vehicles in Household
4 or more Vehicles in Household Comparison
Asians
Menominee
7.0%
4 OR MORE VEHICLES IN HOUSEHOLD
98.6/ 100
METRIC RATING
102nd/ 347
METRIC RANK
5.0%
4 OR MORE VEHICLES IN HOUSEHOLD
0.0/ 100
METRIC RATING
307th/ 347
METRIC RANK
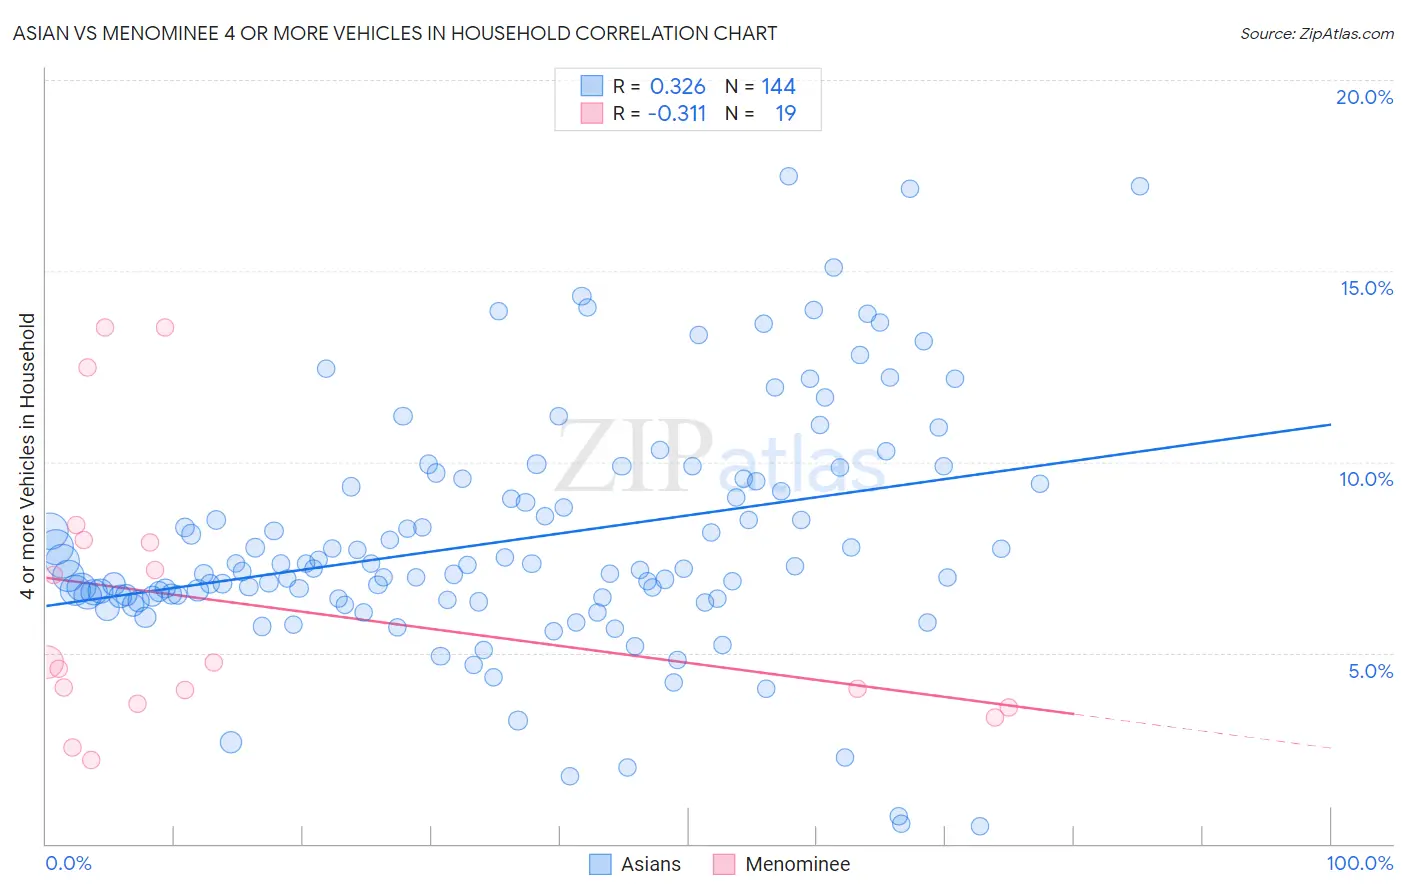
Asian vs Menominee 4 or more Vehicles in Household Correlation Chart
The statistical analysis conducted on geographies consisting of 547,642,894 people shows a mild positive correlation between the proportion of Asians and percentage of households with 4 or more vehicles available in the United States with a correlation coefficient (R) of 0.326 and weighted average of 7.0%. Similarly, the statistical analysis conducted on geographies consisting of 45,762,392 people shows a mild negative correlation between the proportion of Menominee and percentage of households with 4 or more vehicles available in the United States with a correlation coefficient (R) of -0.311 and weighted average of 5.0%, a difference of 40.9%.
4 or more Vehicles in Household Correlation Summary
| Measurement | Asian | Menominee |
| Minimum | 0.45% | 2.2% |
| Maximum | 17.5% | 13.5% |
| Range | 17.0% | 11.3% |
| Mean | 7.9% | 6.3% |
| Median | 7.2% | 4.7% |
| Interquartile 25% (IQ1) | 6.4% | 3.7% |
| Interquartile 75% (IQ3) | 9.5% | 7.9% |
| Interquartile Range (IQR) | 3.0% | 4.3% |
| Standard Deviation (Sample) | 3.1% | 3.6% |
| Standard Deviation (Population) | 3.1% | 3.5% |
Similar Demographics by 4 or more Vehicles in Household
Demographics Similar to Asians by 4 or more Vehicles in Household
In terms of 4 or more vehicles in household, the demographic groups most similar to Asians are Blackfeet (7.0%, a difference of 0.010%), Pakistani (7.0%, a difference of 0.070%), Taiwanese (7.0%, a difference of 0.14%), Seminole (7.0%, a difference of 0.21%), and Hmong (7.0%, a difference of 0.49%).
| Demographics | Rating | Rank | 4 or more Vehicles in Household |
| Czechoslovakians | 99.3 /100 | #95 | Exceptional 7.1% |
| Central Americans | 99.3 /100 | #96 | Exceptional 7.1% |
| Celtics | 99.1 /100 | #97 | Exceptional 7.1% |
| Irish | 99.0 /100 | #98 | Exceptional 7.1% |
| Seminole | 98.8 /100 | #99 | Exceptional 7.0% |
| Taiwanese | 98.7 /100 | #100 | Exceptional 7.0% |
| Pakistanis | 98.7 /100 | #101 | Exceptional 7.0% |
| Asians | 98.6 /100 | #102 | Exceptional 7.0% |
| Blackfeet | 98.6 /100 | #103 | Exceptional 7.0% |
| Hmong | 98.3 /100 | #104 | Exceptional 7.0% |
| German Russians | 98.3 /100 | #105 | Exceptional 7.0% |
| Guatemalans | 98.1 /100 | #106 | Exceptional 7.0% |
| Nicaraguans | 98.0 /100 | #107 | Exceptional 7.0% |
| French | 97.7 /100 | #108 | Exceptional 6.9% |
| Filipinos | 97.6 /100 | #109 | Exceptional 6.9% |
Demographics Similar to Menominee by 4 or more Vehicles in Household
In terms of 4 or more vehicles in household, the demographic groups most similar to Menominee are Paraguayan (4.9%, a difference of 0.72%), Immigrants from Somalia (4.9%, a difference of 0.87%), Immigrants from Serbia (5.0%, a difference of 0.94%), Cypriot (5.0%, a difference of 1.0%), and Somali (5.0%, a difference of 1.0%).
| Demographics | Rating | Rank | 4 or more Vehicles in Household |
| Immigrants | Morocco | 0.0 /100 | #300 | Tragic 5.1% |
| Immigrants | Zaire | 0.0 /100 | #301 | Tragic 5.1% |
| Bahamians | 0.0 /100 | #302 | Tragic 5.1% |
| Immigrants | Greece | 0.0 /100 | #303 | Tragic 5.1% |
| Cypriots | 0.0 /100 | #304 | Tragic 5.0% |
| Somalis | 0.0 /100 | #305 | Tragic 5.0% |
| Immigrants | Serbia | 0.0 /100 | #306 | Tragic 5.0% |
| Menominee | 0.0 /100 | #307 | Tragic 5.0% |
| Paraguayans | 0.0 /100 | #308 | Tragic 4.9% |
| Immigrants | Somalia | 0.0 /100 | #309 | Tragic 4.9% |
| Moroccans | 0.0 /100 | #310 | Tragic 4.9% |
| Houma | 0.0 /100 | #311 | Tragic 4.9% |
| Albanians | 0.0 /100 | #312 | Tragic 4.8% |
| Immigrants | Israel | 0.0 /100 | #313 | Tragic 4.8% |
| Immigrants | West Indies | 0.0 /100 | #314 | Tragic 4.7% |