Armenian vs Immigrants from Ghana 4 or more Vehicles in Household
COMPARE
Armenian
Immigrants from Ghana
4 or more Vehicles in Household
4 or more Vehicles in Household Comparison
Armenians
Immigrants from Ghana
6.6%
4 OR MORE VEHICLES IN HOUSEHOLD
86.9/ 100
METRIC RATING
133rd/ 347
METRIC RANK
5.2%
4 OR MORE VEHICLES IN HOUSEHOLD
0.1/ 100
METRIC RATING
299th/ 347
METRIC RANK
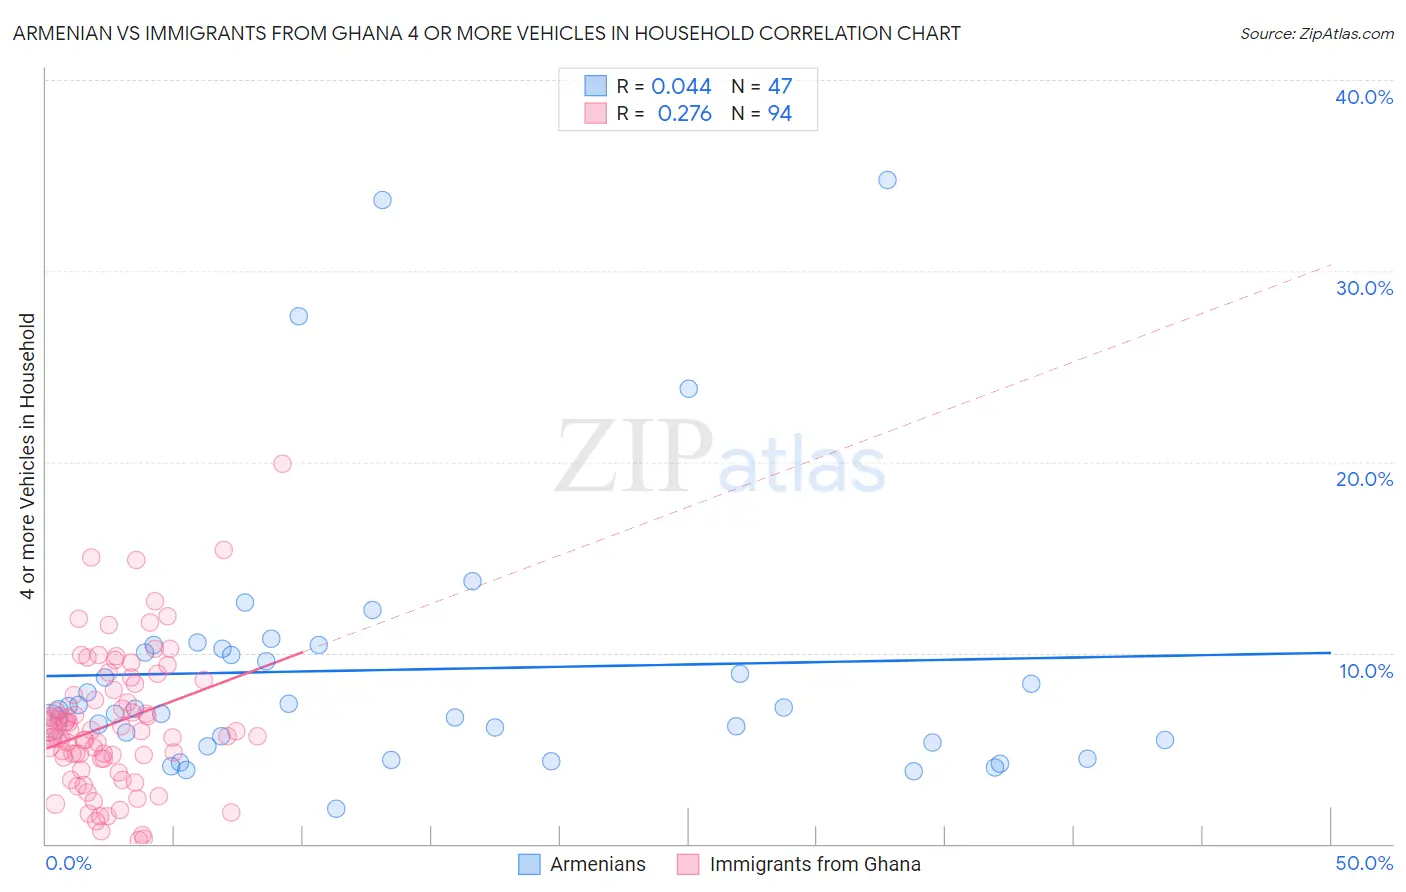
Armenian vs Immigrants from Ghana 4 or more Vehicles in Household Correlation Chart
The statistical analysis conducted on geographies consisting of 309,582,148 people shows no correlation between the proportion of Armenians and percentage of households with 4 or more vehicles available in the United States with a correlation coefficient (R) of 0.044 and weighted average of 6.6%. Similarly, the statistical analysis conducted on geographies consisting of 198,971,687 people shows a weak positive correlation between the proportion of Immigrants from Ghana and percentage of households with 4 or more vehicles available in the United States with a correlation coefficient (R) of 0.276 and weighted average of 5.2%, a difference of 28.1%.
4 or more Vehicles in Household Correlation Summary
| Measurement | Armenian | Immigrants from Ghana |
| Minimum | 1.8% | 0.17% |
| Maximum | 34.8% | 19.9% |
| Range | 33.0% | 19.8% |
| Mean | 9.1% | 6.3% |
| Median | 7.1% | 5.9% |
| Interquartile 25% (IQ1) | 5.3% | 4.4% |
| Interquartile 75% (IQ3) | 10.2% | 8.1% |
| Interquartile Range (IQR) | 4.9% | 3.6% |
| Standard Deviation (Sample) | 7.1% | 3.6% |
| Standard Deviation (Population) | 7.0% | 3.5% |
Similar Demographics by 4 or more Vehicles in Household
Demographics Similar to Armenians by 4 or more Vehicles in Household
In terms of 4 or more vehicles in household, the demographic groups most similar to Armenians are Ottawa (6.6%, a difference of 0.020%), Tohono O'odham (6.6%, a difference of 0.050%), Luxembourger (6.6%, a difference of 0.11%), Immigrants from Netherlands (6.6%, a difference of 0.19%), and French Canadian (6.6%, a difference of 0.32%).
| Demographics | Rating | Rank | 4 or more Vehicles in Household |
| Belgians | 94.1 /100 | #126 | Exceptional 6.8% |
| Immigrants | Korea | 93.8 /100 | #127 | Exceptional 6.8% |
| Immigrants | Bolivia | 92.5 /100 | #128 | Exceptional 6.7% |
| Immigrants | England | 92.0 /100 | #129 | Exceptional 6.7% |
| Immigrants | Scotland | 89.0 /100 | #130 | Excellent 6.7% |
| Maltese | 88.4 /100 | #131 | Excellent 6.7% |
| Immigrants | Netherlands | 87.8 /100 | #132 | Excellent 6.6% |
| Armenians | 86.9 /100 | #133 | Excellent 6.6% |
| Ottawa | 86.9 /100 | #134 | Excellent 6.6% |
| Tohono O'odham | 86.7 /100 | #135 | Excellent 6.6% |
| Luxembourgers | 86.4 /100 | #136 | Excellent 6.6% |
| French Canadians | 85.4 /100 | #137 | Excellent 6.6% |
| Italians | 84.5 /100 | #138 | Excellent 6.6% |
| Jordanians | 82.1 /100 | #139 | Excellent 6.6% |
| Slavs | 81.6 /100 | #140 | Excellent 6.6% |
Demographics Similar to Immigrants from Ghana by 4 or more Vehicles in Household
In terms of 4 or more vehicles in household, the demographic groups most similar to Immigrants from Ghana are Immigrants from South America (5.2%, a difference of 0.46%), Immigrants from Venezuela (5.2%, a difference of 0.79%), Israeli (5.2%, a difference of 1.1%), Immigrants from Brazil (5.2%, a difference of 1.3%), and Ghanaian (5.2%, a difference of 1.4%).
| Demographics | Rating | Rank | 4 or more Vehicles in Household |
| Liberians | 0.1 /100 | #292 | Tragic 5.3% |
| Immigrants | Congo | 0.1 /100 | #293 | Tragic 5.2% |
| Ghanaians | 0.1 /100 | #294 | Tragic 5.2% |
| Immigrants | Brazil | 0.1 /100 | #295 | Tragic 5.2% |
| Israelis | 0.1 /100 | #296 | Tragic 5.2% |
| Immigrants | Venezuela | 0.1 /100 | #297 | Tragic 5.2% |
| Immigrants | South America | 0.1 /100 | #298 | Tragic 5.2% |
| Immigrants | Ghana | 0.1 /100 | #299 | Tragic 5.2% |
| Immigrants | Morocco | 0.0 /100 | #300 | Tragic 5.1% |
| Immigrants | Zaire | 0.0 /100 | #301 | Tragic 5.1% |
| Bahamians | 0.0 /100 | #302 | Tragic 5.1% |
| Immigrants | Greece | 0.0 /100 | #303 | Tragic 5.1% |
| Cypriots | 0.0 /100 | #304 | Tragic 5.0% |
| Somalis | 0.0 /100 | #305 | Tragic 5.0% |
| Immigrants | Serbia | 0.0 /100 | #306 | Tragic 5.0% |