Armenian vs Zimbabwean 1 or more Vehicles in Household
COMPARE
Armenian
Zimbabwean
1 or more Vehicles in Household
1 or more Vehicles in Household Comparison
Armenians
Zimbabweans
90.7%
1 OR MORE VEHICLES IN HOUSEHOLD
94.5/ 100
METRIC RATING
114th/ 347
METRIC RANK
91.0%
1 OR MORE VEHICLES IN HOUSEHOLD
97.7/ 100
METRIC RATING
106th/ 347
METRIC RANK
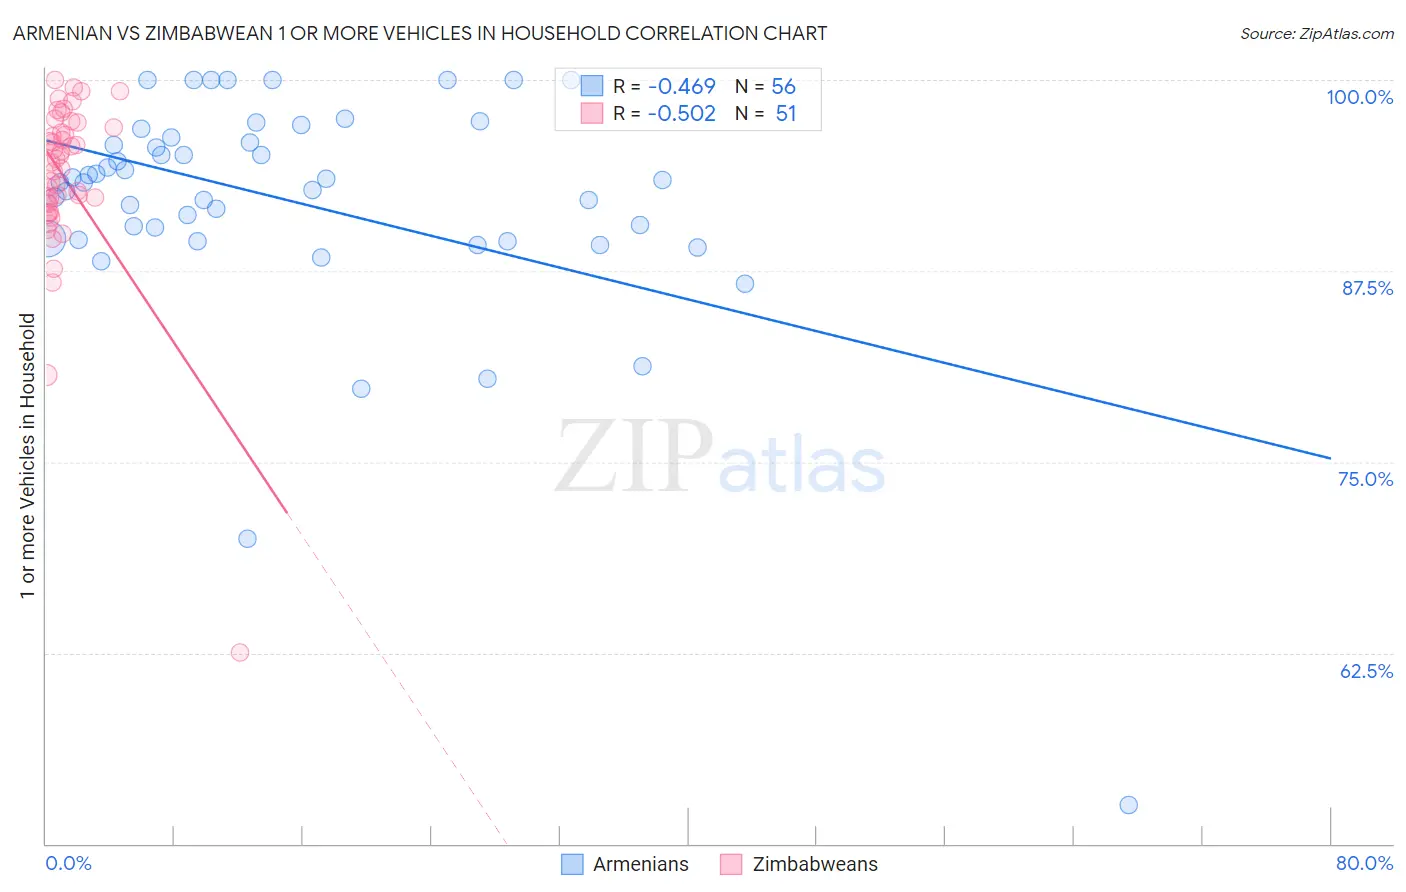
Armenian vs Zimbabwean 1 or more Vehicles in Household Correlation Chart
The statistical analysis conducted on geographies consisting of 310,834,623 people shows a moderate negative correlation between the proportion of Armenians and percentage of households with 1 or more vehicles available in the United States with a correlation coefficient (R) of -0.469 and weighted average of 90.7%. Similarly, the statistical analysis conducted on geographies consisting of 69,192,017 people shows a substantial negative correlation between the proportion of Zimbabweans and percentage of households with 1 or more vehicles available in the United States with a correlation coefficient (R) of -0.502 and weighted average of 91.0%, a difference of 0.36%.
1 or more Vehicles in Household Correlation Summary
| Measurement | Armenian | Zimbabwean |
| Minimum | 52.6% | 62.5% |
| Maximum | 100.0% | 100.0% |
| Range | 47.4% | 37.5% |
| Mean | 92.0% | 93.6% |
| Median | 93.4% | 94.6% |
| Interquartile 25% (IQ1) | 89.6% | 91.9% |
| Interquartile 75% (IQ3) | 96.1% | 96.9% |
| Interquartile Range (IQR) | 6.5% | 5.0% |
| Standard Deviation (Sample) | 7.8% | 5.8% |
| Standard Deviation (Population) | 7.7% | 5.7% |
Demographics Similar to Armenians and Zimbabweans by 1 or more Vehicles in Household
In terms of 1 or more vehicles in household, the demographic groups most similar to Armenians are Immigrants from Kuwait (90.7%, a difference of 0.020%), Serbian (90.7%, a difference of 0.020%), Chippewa (90.7%, a difference of 0.020%), Greek (90.6%, a difference of 0.070%), and Japanese (90.6%, a difference of 0.080%). Similarly, the demographic groups most similar to Zimbabweans are Maltese (91.0%, a difference of 0.020%), Hispanic or Latino (91.0%, a difference of 0.020%), Delaware (91.0%, a difference of 0.020%), Laotian (91.0%, a difference of 0.040%), and Mexican American Indian (91.0%, a difference of 0.050%).
| Demographics | Rating | Rank | 1 or more Vehicles in Household |
| Immigrants | Central America | 98.4 /100 | #100 | Exceptional 91.1% |
| Bulgarians | 98.4 /100 | #101 | Exceptional 91.1% |
| Seminole | 98.3 /100 | #102 | Exceptional 91.1% |
| Yugoslavians | 98.3 /100 | #103 | Exceptional 91.1% |
| Asians | 98.2 /100 | #104 | Exceptional 91.1% |
| Laotians | 98.0 /100 | #105 | Exceptional 91.0% |
| Zimbabweans | 97.7 /100 | #106 | Exceptional 91.0% |
| Maltese | 97.7 /100 | #107 | Exceptional 91.0% |
| Hispanics or Latinos | 97.6 /100 | #108 | Exceptional 91.0% |
| Delaware | 97.6 /100 | #109 | Exceptional 91.0% |
| Mexican American Indians | 97.4 /100 | #110 | Exceptional 91.0% |
| Navajo | 95.8 /100 | #111 | Exceptional 90.8% |
| Immigrants | Netherlands | 95.7 /100 | #112 | Exceptional 90.8% |
| Immigrants | Kuwait | 94.7 /100 | #113 | Exceptional 90.7% |
| Armenians | 94.5 /100 | #114 | Exceptional 90.7% |
| Serbians | 94.3 /100 | #115 | Exceptional 90.7% |
| Chippewa | 94.3 /100 | #116 | Exceptional 90.7% |
| Greeks | 93.5 /100 | #117 | Exceptional 90.6% |
| Japanese | 93.4 /100 | #118 | Exceptional 90.6% |
| Blackfeet | 92.6 /100 | #119 | Exceptional 90.6% |
| Immigrants | Thailand | 92.3 /100 | #120 | Exceptional 90.6% |