Argentinean vs Immigrants from Uruguay 1 or more Vehicles in Household
COMPARE
Argentinean
Immigrants from Uruguay
1 or more Vehicles in Household
1 or more Vehicles in Household Comparison
Argentineans
Immigrants from Uruguay
88.9%
1 OR MORE VEHICLES IN HOUSEHOLD
8.8/ 100
METRIC RATING
217th/ 347
METRIC RANK
88.1%
1 OR MORE VEHICLES IN HOUSEHOLD
1.1/ 100
METRIC RATING
252nd/ 347
METRIC RANK
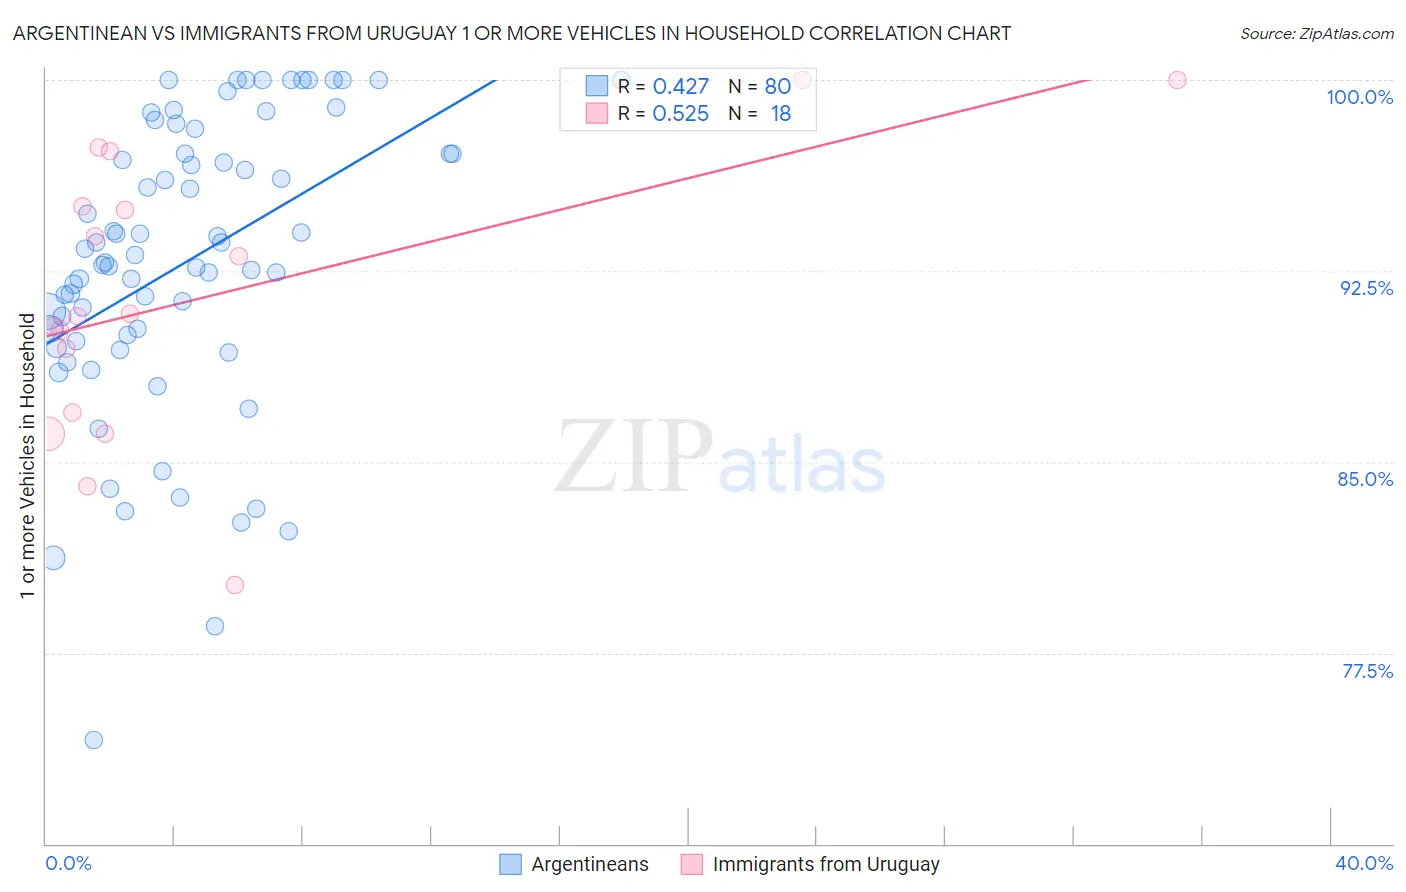
Argentinean vs Immigrants from Uruguay 1 or more Vehicles in Household Correlation Chart
The statistical analysis conducted on geographies consisting of 297,015,008 people shows a moderate positive correlation between the proportion of Argentineans and percentage of households with 1 or more vehicles available in the United States with a correlation coefficient (R) of 0.427 and weighted average of 88.9%. Similarly, the statistical analysis conducted on geographies consisting of 133,245,142 people shows a substantial positive correlation between the proportion of Immigrants from Uruguay and percentage of households with 1 or more vehicles available in the United States with a correlation coefficient (R) of 0.525 and weighted average of 88.1%, a difference of 0.87%.
1 or more Vehicles in Household Correlation Summary
| Measurement | Argentinean | Immigrants from Uruguay |
| Minimum | 74.1% | 80.2% |
| Maximum | 100.0% | 100.0% |
| Range | 25.9% | 19.8% |
| Mean | 92.8% | 91.5% |
| Median | 93.0% | 90.8% |
| Interquartile 25% (IQ1) | 89.9% | 87.0% |
| Interquartile 75% (IQ3) | 97.1% | 95.0% |
| Interquartile Range (IQR) | 7.2% | 8.1% |
| Standard Deviation (Sample) | 5.7% | 5.5% |
| Standard Deviation (Population) | 5.7% | 5.3% |
Similar Demographics by 1 or more Vehicles in Household
Demographics Similar to Argentineans by 1 or more Vehicles in Household
In terms of 1 or more vehicles in household, the demographic groups most similar to Argentineans are Ugandan (88.9%, a difference of 0.010%), Immigrants from Guatemala (88.9%, a difference of 0.010%), Immigrants from Argentina (88.9%, a difference of 0.030%), Immigrants from Zaire (88.8%, a difference of 0.040%), and Peruvian (88.8%, a difference of 0.050%).
| Demographics | Rating | Rank | 1 or more Vehicles in Household |
| Dutch West Indians | 13.5 /100 | #210 | Poor 89.0% |
| Sierra Leoneans | 13.0 /100 | #211 | Poor 89.0% |
| Somalis | 12.8 /100 | #212 | Poor 89.0% |
| Immigrants | Western Asia | 12.3 /100 | #213 | Poor 89.0% |
| Immigrants | Hungary | 11.9 /100 | #214 | Poor 89.0% |
| Immigrants | Sri Lanka | 10.2 /100 | #215 | Poor 88.9% |
| Immigrants | Argentina | 9.4 /100 | #216 | Tragic 88.9% |
| Argentineans | 8.8 /100 | #217 | Tragic 88.9% |
| Ugandans | 8.7 /100 | #218 | Tragic 88.9% |
| Immigrants | Guatemala | 8.6 /100 | #219 | Tragic 88.9% |
| Immigrants | Zaire | 8.1 /100 | #220 | Tragic 88.8% |
| Peruvians | 7.9 /100 | #221 | Tragic 88.8% |
| Uruguayans | 7.0 /100 | #222 | Tragic 88.8% |
| Immigrants | South America | 7.0 /100 | #223 | Tragic 88.8% |
| Immigrants | Hong Kong | 6.2 /100 | #224 | Tragic 88.7% |
Demographics Similar to Immigrants from Uruguay by 1 or more Vehicles in Household
In terms of 1 or more vehicles in household, the demographic groups most similar to Immigrants from Uruguay are Honduran (88.1%, a difference of 0.030%), Haitian (88.1%, a difference of 0.040%), Immigrants from Serbia (88.2%, a difference of 0.050%), Egyptian (88.2%, a difference of 0.060%), and Immigrants from Latvia (88.1%, a difference of 0.060%).
| Demographics | Rating | Rank | 1 or more Vehicles in Household |
| Immigrants | Czechoslovakia | 1.9 /100 | #245 | Tragic 88.3% |
| Menominee | 1.9 /100 | #246 | Tragic 88.3% |
| Immigrants | Honduras | 1.7 /100 | #247 | Tragic 88.3% |
| Immigrants | Nigeria | 1.5 /100 | #248 | Tragic 88.2% |
| Blacks/African Americans | 1.4 /100 | #249 | Tragic 88.2% |
| Egyptians | 1.2 /100 | #250 | Tragic 88.2% |
| Immigrants | Serbia | 1.2 /100 | #251 | Tragic 88.2% |
| Immigrants | Uruguay | 1.1 /100 | #252 | Tragic 88.1% |
| Hondurans | 1.0 /100 | #253 | Tragic 88.1% |
| Haitians | 0.9 /100 | #254 | Tragic 88.1% |
| Immigrants | Latvia | 0.9 /100 | #255 | Tragic 88.1% |
| Colombians | 0.9 /100 | #256 | Tragic 88.0% |
| Liberians | 0.9 /100 | #257 | Tragic 88.0% |
| South American Indians | 0.9 /100 | #258 | Tragic 88.0% |
| Nigerians | 0.8 /100 | #259 | Tragic 88.0% |