Alsatian vs Colombian 11th Grade
COMPARE
Alsatian
Colombian
11th Grade
11th Grade Comparison
Alsatians
Colombians
92.6%
11TH GRADE
60.2/ 100
METRIC RATING
167th/ 347
METRIC RANK
91.7%
11TH GRADE
2.8/ 100
METRIC RATING
236th/ 347
METRIC RANK
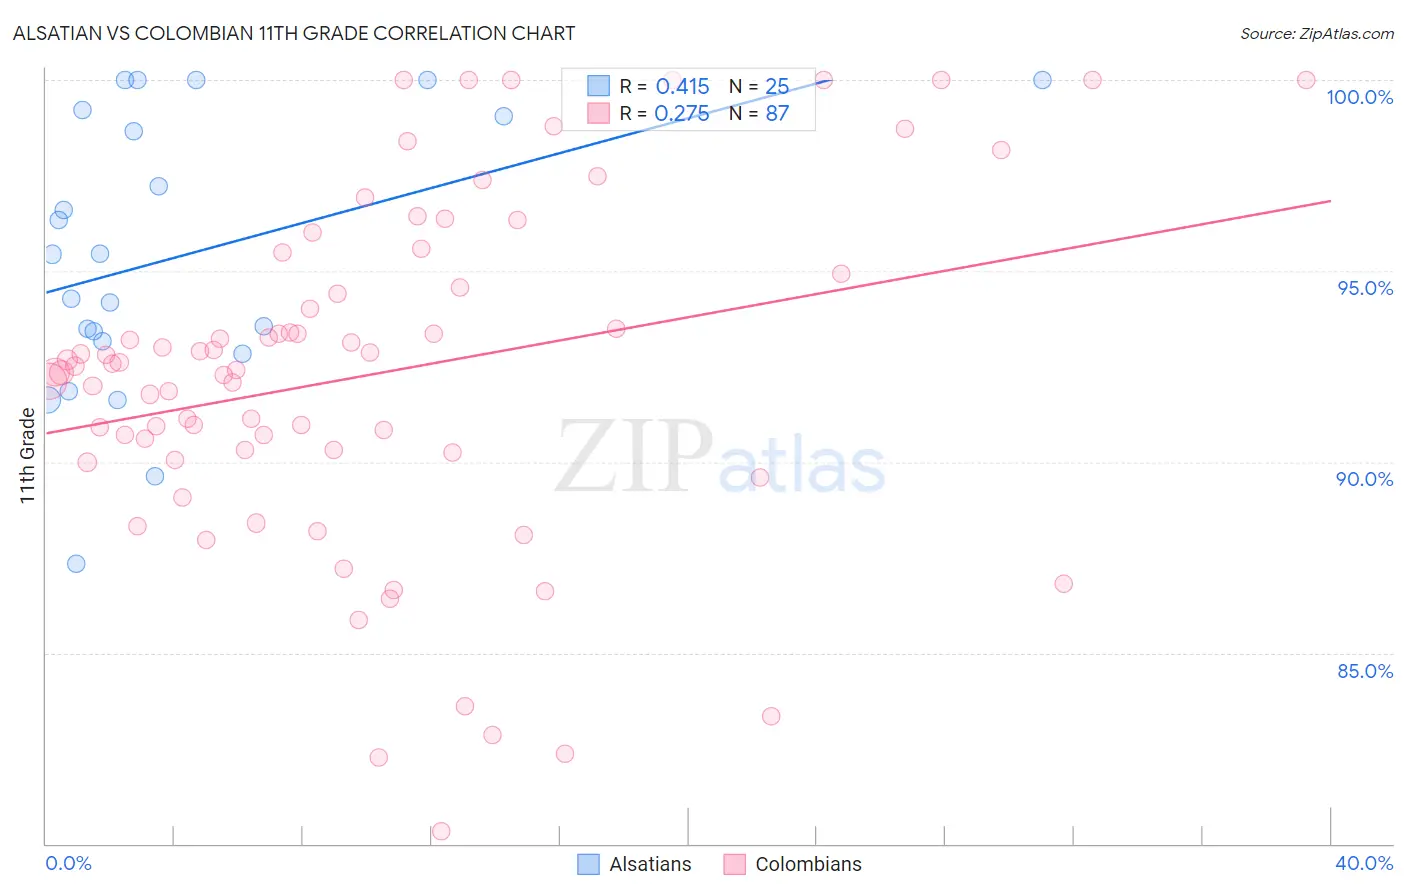
Alsatian vs Colombian 11th Grade Correlation Chart
The statistical analysis conducted on geographies consisting of 82,682,365 people shows a moderate positive correlation between the proportion of Alsatians and percentage of population with at least 11th grade education in the United States with a correlation coefficient (R) of 0.415 and weighted average of 92.6%. Similarly, the statistical analysis conducted on geographies consisting of 419,682,710 people shows a weak positive correlation between the proportion of Colombians and percentage of population with at least 11th grade education in the United States with a correlation coefficient (R) of 0.275 and weighted average of 91.7%, a difference of 0.98%.
11th Grade Correlation Summary
| Measurement | Alsatian | Colombian |
| Minimum | 87.3% | 80.3% |
| Maximum | 100.0% | 100.0% |
| Range | 12.7% | 19.7% |
| Mean | 95.4% | 92.3% |
| Median | 95.4% | 92.5% |
| Interquartile 25% (IQ1) | 93.0% | 90.3% |
| Interquartile 75% (IQ3) | 99.1% | 94.9% |
| Interquartile Range (IQR) | 6.1% | 4.7% |
| Standard Deviation (Sample) | 3.6% | 4.5% |
| Standard Deviation (Population) | 3.6% | 4.5% |
Similar Demographics by 11th Grade
Demographics Similar to Alsatians by 11th Grade
In terms of 11th grade, the demographic groups most similar to Alsatians are Bermudan (92.6%, a difference of 0.020%), Sierra Leonean (92.6%, a difference of 0.020%), Immigrants from Albania (92.6%, a difference of 0.020%), Immigrants from Northern Africa (92.6%, a difference of 0.030%), and Immigrants from Iraq (92.6%, a difference of 0.040%).
| Demographics | Rating | Rank | 11th Grade |
| Immigrants | Lebanon | 70.7 /100 | #160 | Good 92.7% |
| Immigrants | Argentina | 69.8 /100 | #161 | Good 92.7% |
| Paraguayans | 68.7 /100 | #162 | Good 92.7% |
| Immigrants | Nonimmigrants | 66.6 /100 | #163 | Good 92.7% |
| Spanish | 66.2 /100 | #164 | Good 92.7% |
| Immigrants | Iraq | 63.7 /100 | #165 | Good 92.6% |
| Bermudans | 62.3 /100 | #166 | Good 92.6% |
| Alsatians | 60.2 /100 | #167 | Good 92.6% |
| Sierra Leoneans | 58.7 /100 | #168 | Average 92.6% |
| Immigrants | Albania | 57.8 /100 | #169 | Average 92.6% |
| Immigrants | Northern Africa | 57.3 /100 | #170 | Average 92.6% |
| Laotians | 54.4 /100 | #171 | Average 92.6% |
| Immigrants | Pakistan | 52.3 /100 | #172 | Average 92.5% |
| Indians (Asian) | 51.5 /100 | #173 | Average 92.5% |
| Asians | 50.0 /100 | #174 | Average 92.5% |
Demographics Similar to Colombians by 11th Grade
In terms of 11th grade, the demographic groups most similar to Colombians are Subsaharan African (91.7%, a difference of 0.0%), Immigrants from Bolivia (91.7%, a difference of 0.0%), Armenian (91.7%, a difference of 0.010%), Comanche (91.7%, a difference of 0.020%), and Hopi (91.7%, a difference of 0.030%).
| Demographics | Rating | Rank | 11th Grade |
| Nigerians | 4.3 /100 | #229 | Tragic 91.8% |
| Immigrants | Afghanistan | 3.9 /100 | #230 | Tragic 91.8% |
| Choctaw | 3.7 /100 | #231 | Tragic 91.8% |
| Uruguayans | 3.5 /100 | #232 | Tragic 91.8% |
| Cheyenne | 3.3 /100 | #233 | Tragic 91.8% |
| Armenians | 2.9 /100 | #234 | Tragic 91.7% |
| Sub-Saharan Africans | 2.9 /100 | #235 | Tragic 91.7% |
| Colombians | 2.8 /100 | #236 | Tragic 91.7% |
| Immigrants | Bolivia | 2.8 /100 | #237 | Tragic 91.7% |
| Comanche | 2.6 /100 | #238 | Tragic 91.7% |
| Hopi | 2.5 /100 | #239 | Tragic 91.7% |
| South Americans | 2.0 /100 | #240 | Tragic 91.6% |
| Bahamians | 1.8 /100 | #241 | Tragic 91.6% |
| Immigrants | Middle Africa | 1.6 /100 | #242 | Tragic 91.6% |
| Immigrants | Thailand | 1.4 /100 | #243 | Tragic 91.6% |