Afghan vs Immigrants from El Salvador 4 or more Vehicles in Household
COMPARE
Afghan
Immigrants from El Salvador
4 or more Vehicles in Household
4 or more Vehicles in Household Comparison
Afghans
Immigrants from El Salvador
7.3%
4 OR MORE VEHICLES IN HOUSEHOLD
99.7/ 100
METRIC RATING
84th/ 347
METRIC RANK
7.7%
4 OR MORE VEHICLES IN HOUSEHOLD
100.0/ 100
METRIC RATING
50th/ 347
METRIC RANK
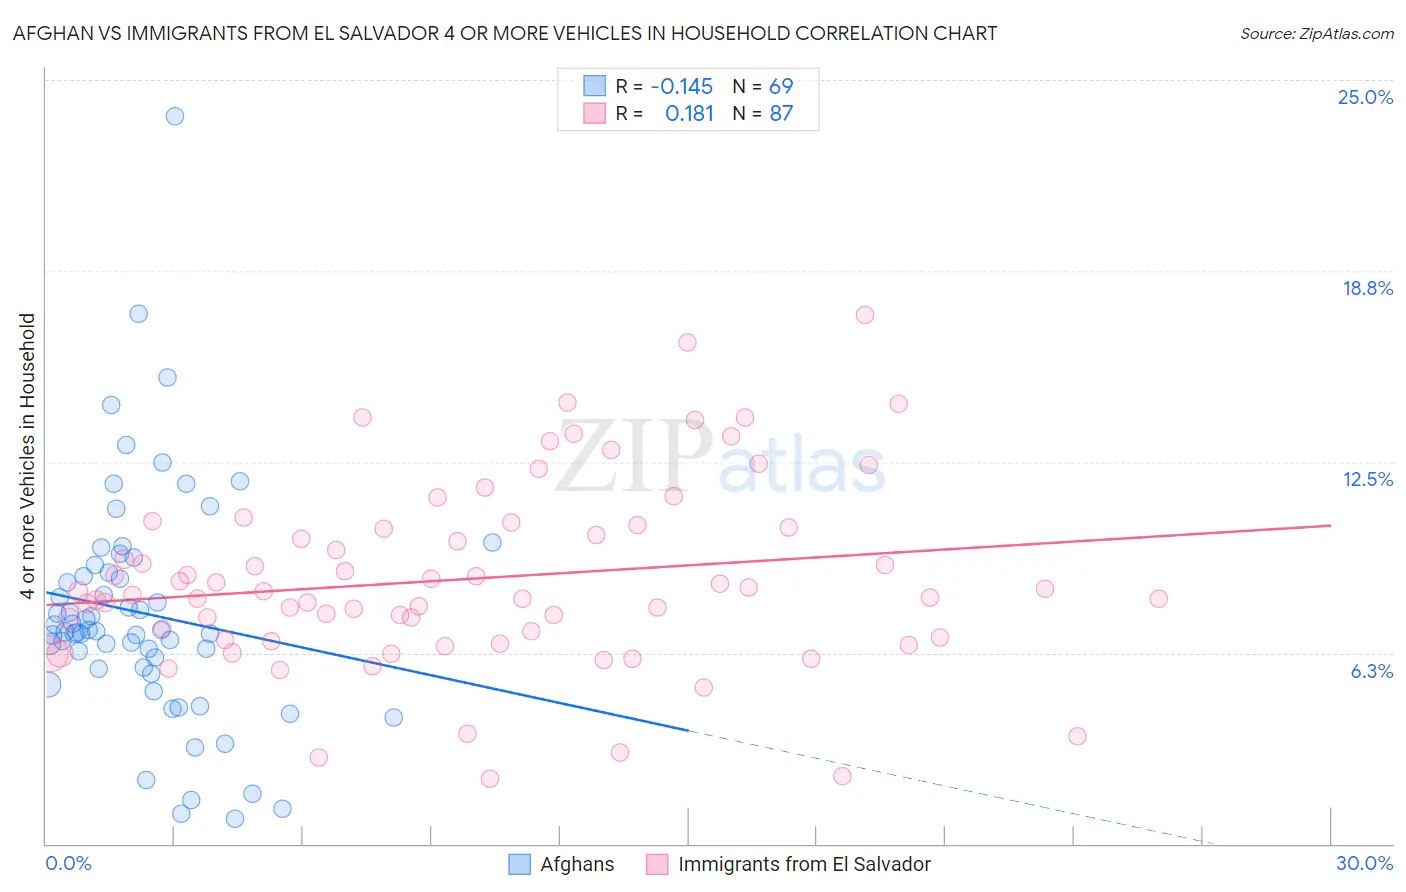
Afghan vs Immigrants from El Salvador 4 or more Vehicles in Household Correlation Chart
The statistical analysis conducted on geographies consisting of 148,454,289 people shows a poor negative correlation between the proportion of Afghans and percentage of households with 4 or more vehicles available in the United States with a correlation coefficient (R) of -0.145 and weighted average of 7.3%. Similarly, the statistical analysis conducted on geographies consisting of 356,356,218 people shows a poor positive correlation between the proportion of Immigrants from El Salvador and percentage of households with 4 or more vehicles available in the United States with a correlation coefficient (R) of 0.181 and weighted average of 7.7%, a difference of 6.6%.
4 or more Vehicles in Household Correlation Summary
| Measurement | Afghan | Immigrants from El Salvador |
| Minimum | 0.82% | 2.1% |
| Maximum | 23.8% | 17.3% |
| Range | 23.0% | 15.2% |
| Mean | 7.5% | 8.7% |
| Median | 7.0% | 8.2% |
| Interquartile 25% (IQ1) | 5.8% | 6.7% |
| Interquartile 75% (IQ3) | 9.0% | 10.4% |
| Interquartile Range (IQR) | 3.2% | 3.7% |
| Standard Deviation (Sample) | 3.8% | 3.0% |
| Standard Deviation (Population) | 3.8% | 3.0% |
Similar Demographics by 4 or more Vehicles in Household
Demographics Similar to Afghans by 4 or more Vehicles in Household
In terms of 4 or more vehicles in household, the demographic groups most similar to Afghans are Cree (7.2%, a difference of 0.17%), Potawatomi (7.3%, a difference of 0.33%), Immigrants from Indonesia (7.2%, a difference of 0.35%), Delaware (7.2%, a difference of 0.41%), and Nonimmigrants (7.2%, a difference of 0.43%).
| Demographics | Rating | Rank | 4 or more Vehicles in Household |
| Apache | 99.9 /100 | #77 | Exceptional 7.4% |
| Whites/Caucasians | 99.8 /100 | #78 | Exceptional 7.4% |
| Czechs | 99.8 /100 | #79 | Exceptional 7.4% |
| Alaska Natives | 99.8 /100 | #80 | Exceptional 7.3% |
| Finns | 99.8 /100 | #81 | Exceptional 7.3% |
| Northern Europeans | 99.8 /100 | #82 | Exceptional 7.3% |
| Potawatomi | 99.7 /100 | #83 | Exceptional 7.3% |
| Afghans | 99.7 /100 | #84 | Exceptional 7.3% |
| Cree | 99.7 /100 | #85 | Exceptional 7.2% |
| Immigrants | Indonesia | 99.6 /100 | #86 | Exceptional 7.2% |
| Delaware | 99.6 /100 | #87 | Exceptional 7.2% |
| Immigrants | Nonimmigrants | 99.6 /100 | #88 | Exceptional 7.2% |
| British | 99.6 /100 | #89 | Exceptional 7.2% |
| Creek | 99.6 /100 | #90 | Exceptional 7.2% |
| Assyrians/Chaldeans/Syriacs | 99.4 /100 | #91 | Exceptional 7.2% |
Demographics Similar to Immigrants from El Salvador by 4 or more Vehicles in Household
In terms of 4 or more vehicles in household, the demographic groups most similar to Immigrants from El Salvador are Cherokee (7.7%, a difference of 0.16%), Swiss (7.8%, a difference of 0.35%), Immigrants from Laos (7.7%, a difference of 0.35%), Japanese (7.7%, a difference of 0.47%), and Osage (7.8%, a difference of 0.52%).
| Demographics | Rating | Rank | 4 or more Vehicles in Household |
| Fijians | 100.0 /100 | #43 | Exceptional 7.8% |
| Bhutanese | 100.0 /100 | #44 | Exceptional 7.8% |
| Choctaw | 100.0 /100 | #45 | Exceptional 7.8% |
| Crow | 100.0 /100 | #46 | Exceptional 7.8% |
| Osage | 100.0 /100 | #47 | Exceptional 7.8% |
| Swiss | 100.0 /100 | #48 | Exceptional 7.8% |
| Cherokee | 100.0 /100 | #49 | Exceptional 7.7% |
| Immigrants | El Salvador | 100.0 /100 | #50 | Exceptional 7.7% |
| Immigrants | Laos | 100.0 /100 | #51 | Exceptional 7.7% |
| Japanese | 100.0 /100 | #52 | Exceptional 7.7% |
| Malaysians | 100.0 /100 | #53 | Exceptional 7.7% |
| Dutch | 100.0 /100 | #54 | Exceptional 7.7% |
| Immigrants | Oceania | 100.0 /100 | #55 | Exceptional 7.6% |
| English | 100.0 /100 | #56 | Exceptional 7.6% |
| Pennsylvania Germans | 100.0 /100 | #57 | Exceptional 7.6% |