Afghan vs Immigrants from Russia 4 or more Vehicles in Household
COMPARE
Afghan
Immigrants from Russia
4 or more Vehicles in Household
4 or more Vehicles in Household Comparison
Afghans
Immigrants from Russia
7.3%
4 OR MORE VEHICLES IN HOUSEHOLD
99.7/ 100
METRIC RATING
84th/ 347
METRIC RANK
5.3%
4 OR MORE VEHICLES IN HOUSEHOLD
0.2/ 100
METRIC RATING
290th/ 347
METRIC RANK
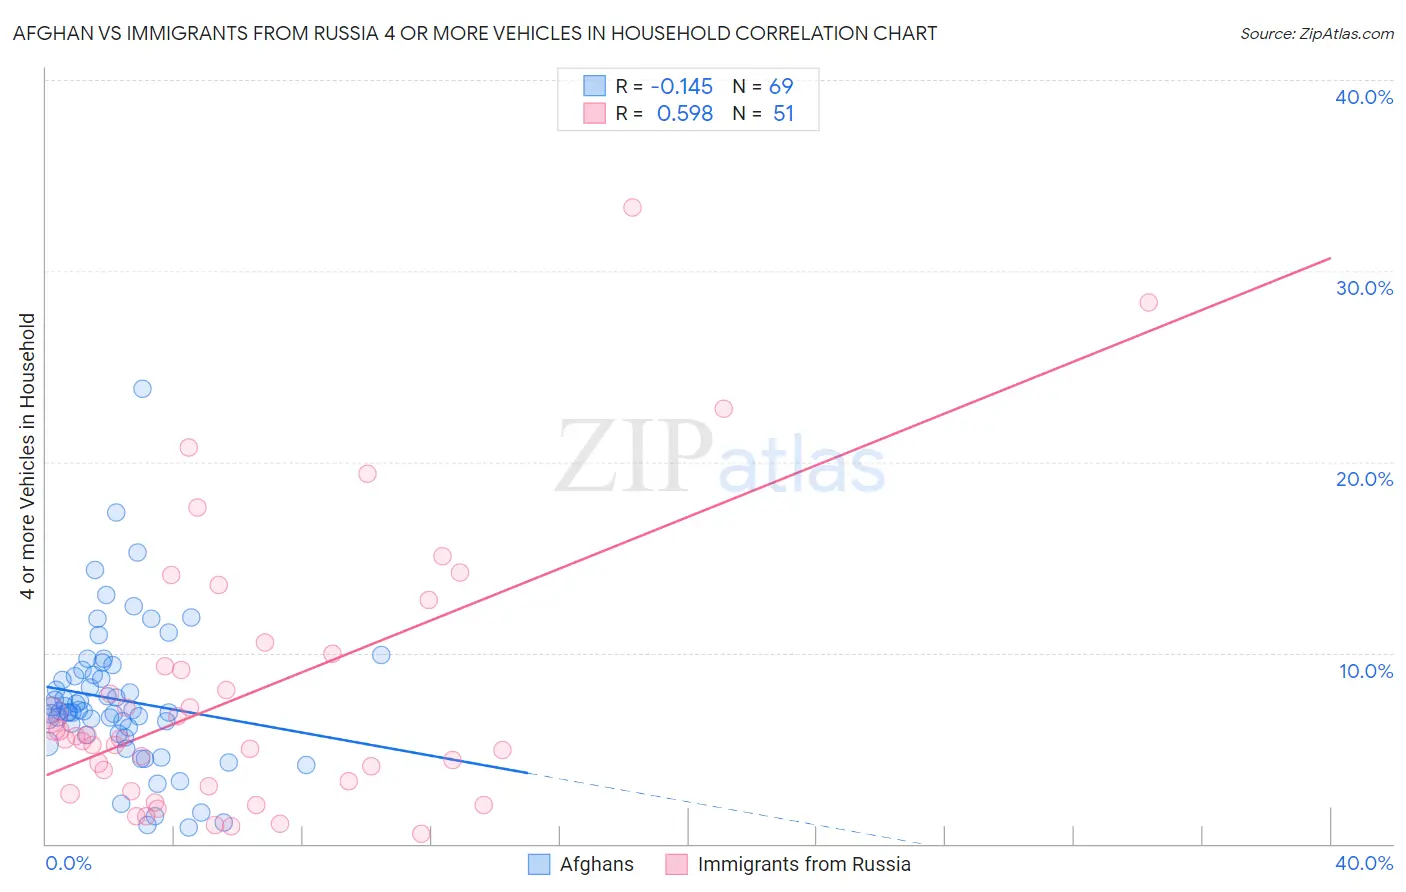
Afghan vs Immigrants from Russia 4 or more Vehicles in Household Correlation Chart
The statistical analysis conducted on geographies consisting of 148,454,289 people shows a poor negative correlation between the proportion of Afghans and percentage of households with 4 or more vehicles available in the United States with a correlation coefficient (R) of -0.145 and weighted average of 7.3%. Similarly, the statistical analysis conducted on geographies consisting of 346,141,133 people shows a substantial positive correlation between the proportion of Immigrants from Russia and percentage of households with 4 or more vehicles available in the United States with a correlation coefficient (R) of 0.598 and weighted average of 5.3%, a difference of 36.4%.
4 or more Vehicles in Household Correlation Summary
| Measurement | Afghan | Immigrants from Russia |
| Minimum | 0.82% | 0.50% |
| Maximum | 23.8% | 33.3% |
| Range | 23.0% | 32.8% |
| Mean | 7.5% | 7.9% |
| Median | 7.0% | 5.5% |
| Interquartile 25% (IQ1) | 5.8% | 3.0% |
| Interquartile 75% (IQ3) | 9.0% | 9.9% |
| Interquartile Range (IQR) | 3.2% | 6.9% |
| Standard Deviation (Sample) | 3.8% | 7.1% |
| Standard Deviation (Population) | 3.8% | 7.1% |
Similar Demographics by 4 or more Vehicles in Household
Demographics Similar to Afghans by 4 or more Vehicles in Household
In terms of 4 or more vehicles in household, the demographic groups most similar to Afghans are Cree (7.2%, a difference of 0.17%), Potawatomi (7.3%, a difference of 0.33%), Immigrants from Indonesia (7.2%, a difference of 0.35%), Delaware (7.2%, a difference of 0.41%), and Nonimmigrants (7.2%, a difference of 0.43%).
| Demographics | Rating | Rank | 4 or more Vehicles in Household |
| Apache | 99.9 /100 | #77 | Exceptional 7.4% |
| Whites/Caucasians | 99.8 /100 | #78 | Exceptional 7.4% |
| Czechs | 99.8 /100 | #79 | Exceptional 7.4% |
| Alaska Natives | 99.8 /100 | #80 | Exceptional 7.3% |
| Finns | 99.8 /100 | #81 | Exceptional 7.3% |
| Northern Europeans | 99.8 /100 | #82 | Exceptional 7.3% |
| Potawatomi | 99.7 /100 | #83 | Exceptional 7.3% |
| Afghans | 99.7 /100 | #84 | Exceptional 7.3% |
| Cree | 99.7 /100 | #85 | Exceptional 7.2% |
| Immigrants | Indonesia | 99.6 /100 | #86 | Exceptional 7.2% |
| Delaware | 99.6 /100 | #87 | Exceptional 7.2% |
| Immigrants | Nonimmigrants | 99.6 /100 | #88 | Exceptional 7.2% |
| British | 99.6 /100 | #89 | Exceptional 7.2% |
| Creek | 99.6 /100 | #90 | Exceptional 7.2% |
| Assyrians/Chaldeans/Syriacs | 99.4 /100 | #91 | Exceptional 7.2% |
Demographics Similar to Immigrants from Russia by 4 or more Vehicles in Household
In terms of 4 or more vehicles in household, the demographic groups most similar to Immigrants from Russia are Immigrants from Bosnia and Herzegovina (5.3%, a difference of 0.30%), Venezuelan (5.3%, a difference of 0.44%), Immigrants from Croatia (5.4%, a difference of 0.63%), Immigrants from Colombia (5.4%, a difference of 0.72%), and Immigrants from Liberia (5.4%, a difference of 0.76%).
| Demographics | Rating | Rank | 4 or more Vehicles in Household |
| Immigrants | Ireland | 0.3 /100 | #283 | Tragic 5.4% |
| Brazilians | 0.3 /100 | #284 | Tragic 5.4% |
| Immigrants | Liberia | 0.2 /100 | #285 | Tragic 5.4% |
| Immigrants | Colombia | 0.2 /100 | #286 | Tragic 5.4% |
| Immigrants | Croatia | 0.2 /100 | #287 | Tragic 5.4% |
| Venezuelans | 0.2 /100 | #288 | Tragic 5.3% |
| Immigrants | Bosnia and Herzegovina | 0.2 /100 | #289 | Tragic 5.3% |
| Immigrants | Russia | 0.2 /100 | #290 | Tragic 5.3% |
| Immigrants | Bahamas | 0.1 /100 | #291 | Tragic 5.3% |
| Liberians | 0.1 /100 | #292 | Tragic 5.3% |
| Immigrants | Congo | 0.1 /100 | #293 | Tragic 5.2% |
| Ghanaians | 0.1 /100 | #294 | Tragic 5.2% |
| Immigrants | Brazil | 0.1 /100 | #295 | Tragic 5.2% |
| Israelis | 0.1 /100 | #296 | Tragic 5.2% |
| Immigrants | Venezuela | 0.1 /100 | #297 | Tragic 5.2% |