Immigrants from North Macedonia vs Immigrants from Russia 4 or more Vehicles in Household
COMPARE
Immigrants from North Macedonia
Immigrants from Russia
4 or more Vehicles in Household
4 or more Vehicles in Household Comparison
Immigrants from North Macedonia
Immigrants from Russia
5.7%
4 OR MORE VEHICLES IN HOUSEHOLD
2.5/ 100
METRIC RATING
246th/ 347
METRIC RANK
5.3%
4 OR MORE VEHICLES IN HOUSEHOLD
0.2/ 100
METRIC RATING
290th/ 347
METRIC RANK
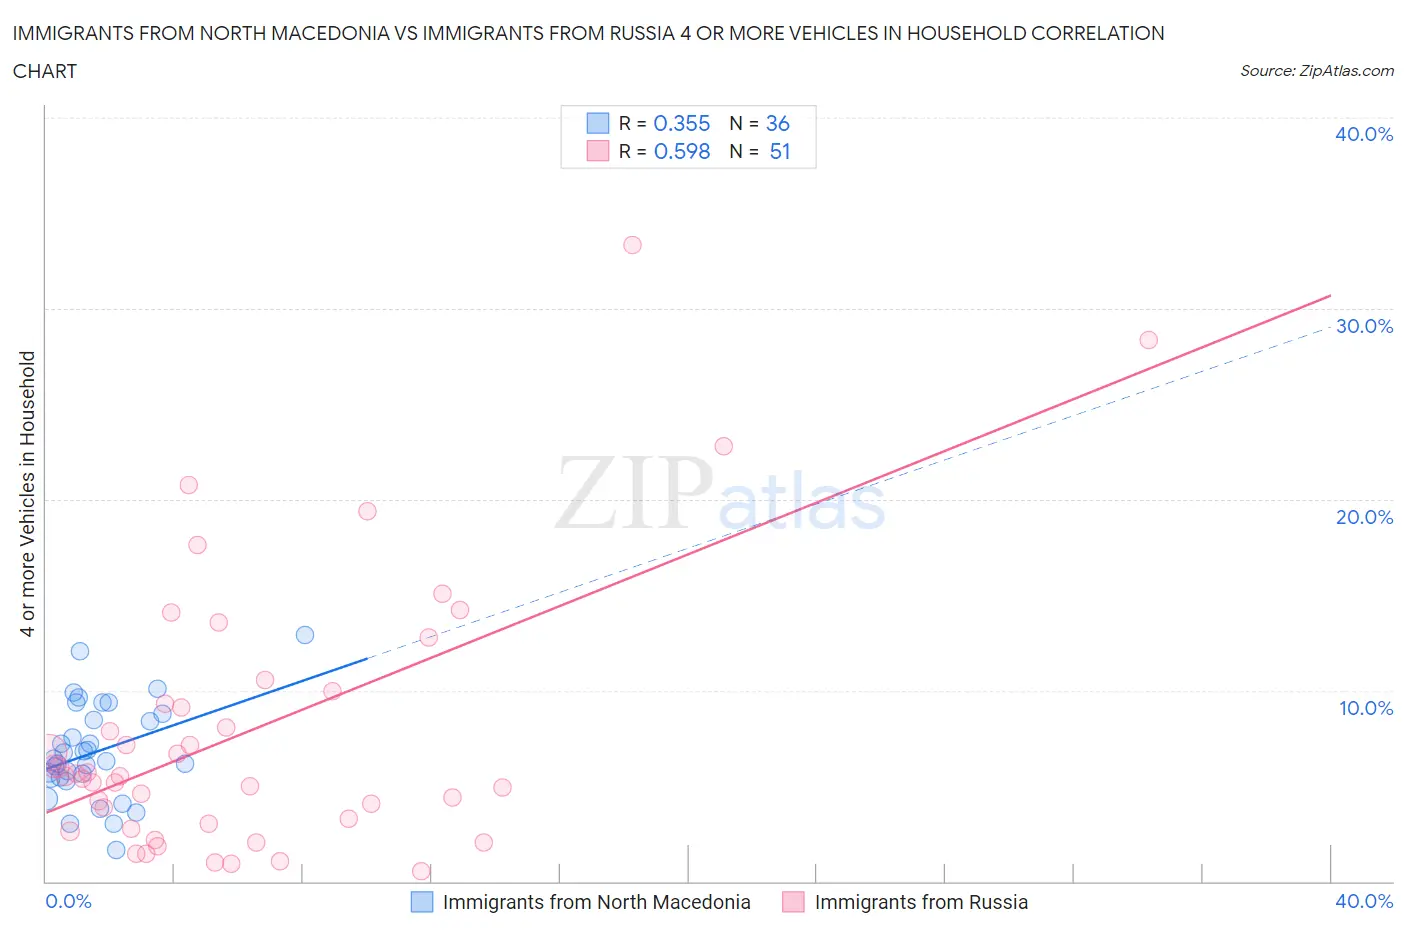
Immigrants from North Macedonia vs Immigrants from Russia 4 or more Vehicles in Household Correlation Chart
The statistical analysis conducted on geographies consisting of 74,089,047 people shows a mild positive correlation between the proportion of Immigrants from North Macedonia and percentage of households with 4 or more vehicles available in the United States with a correlation coefficient (R) of 0.355 and weighted average of 5.7%. Similarly, the statistical analysis conducted on geographies consisting of 346,141,133 people shows a substantial positive correlation between the proportion of Immigrants from Russia and percentage of households with 4 or more vehicles available in the United States with a correlation coefficient (R) of 0.598 and weighted average of 5.3%, a difference of 7.9%.
4 or more Vehicles in Household Correlation Summary
| Measurement | Immigrants from North Macedonia | Immigrants from Russia |
| Minimum | 1.6% | 0.50% |
| Maximum | 12.9% | 33.3% |
| Range | 11.3% | 32.8% |
| Mean | 6.8% | 7.9% |
| Median | 6.3% | 5.5% |
| Interquartile 25% (IQ1) | 5.4% | 3.0% |
| Interquartile 75% (IQ3) | 8.6% | 9.9% |
| Interquartile Range (IQR) | 3.2% | 6.9% |
| Standard Deviation (Sample) | 2.5% | 7.1% |
| Standard Deviation (Population) | 2.5% | 7.1% |
Similar Demographics by 4 or more Vehicles in Household
Demographics Similar to Immigrants from North Macedonia by 4 or more Vehicles in Household
In terms of 4 or more vehicles in household, the demographic groups most similar to Immigrants from North Macedonia are Immigrants from Ethiopia (5.7%, a difference of 0.030%), Immigrants from Eastern Africa (5.7%, a difference of 0.14%), Immigrants from Southern Europe (5.7%, a difference of 0.16%), Immigrants from Europe (5.7%, a difference of 0.26%), and Ugandan (5.7%, a difference of 0.28%).
| Demographics | Rating | Rank | 4 or more Vehicles in Household |
| Immigrants | Australia | 3.8 /100 | #239 | Tragic 5.8% |
| Immigrants | Poland | 3.8 /100 | #240 | Tragic 5.8% |
| Mongolians | 3.7 /100 | #241 | Tragic 5.8% |
| Immigrants | Middle Africa | 3.4 /100 | #242 | Tragic 5.8% |
| Immigrants | Czechoslovakia | 3.2 /100 | #243 | Tragic 5.8% |
| Ethiopians | 3.2 /100 | #244 | Tragic 5.8% |
| Bulgarians | 3.1 /100 | #245 | Tragic 5.8% |
| Immigrants | North Macedonia | 2.5 /100 | #246 | Tragic 5.7% |
| Immigrants | Ethiopia | 2.4 /100 | #247 | Tragic 5.7% |
| Immigrants | Eastern Africa | 2.4 /100 | #248 | Tragic 5.7% |
| Immigrants | Southern Europe | 2.3 /100 | #249 | Tragic 5.7% |
| Immigrants | Europe | 2.3 /100 | #250 | Tragic 5.7% |
| Ugandans | 2.2 /100 | #251 | Tragic 5.7% |
| Sub-Saharan Africans | 2.1 /100 | #252 | Tragic 5.7% |
| Immigrants | Cuba | 1.6 /100 | #253 | Tragic 5.7% |
Demographics Similar to Immigrants from Russia by 4 or more Vehicles in Household
In terms of 4 or more vehicles in household, the demographic groups most similar to Immigrants from Russia are Immigrants from Bosnia and Herzegovina (5.3%, a difference of 0.30%), Venezuelan (5.3%, a difference of 0.44%), Immigrants from Croatia (5.4%, a difference of 0.63%), Immigrants from Colombia (5.4%, a difference of 0.72%), and Immigrants from Liberia (5.4%, a difference of 0.76%).
| Demographics | Rating | Rank | 4 or more Vehicles in Household |
| Immigrants | Ireland | 0.3 /100 | #283 | Tragic 5.4% |
| Brazilians | 0.3 /100 | #284 | Tragic 5.4% |
| Immigrants | Liberia | 0.2 /100 | #285 | Tragic 5.4% |
| Immigrants | Colombia | 0.2 /100 | #286 | Tragic 5.4% |
| Immigrants | Croatia | 0.2 /100 | #287 | Tragic 5.4% |
| Venezuelans | 0.2 /100 | #288 | Tragic 5.3% |
| Immigrants | Bosnia and Herzegovina | 0.2 /100 | #289 | Tragic 5.3% |
| Immigrants | Russia | 0.2 /100 | #290 | Tragic 5.3% |
| Immigrants | Bahamas | 0.1 /100 | #291 | Tragic 5.3% |
| Liberians | 0.1 /100 | #292 | Tragic 5.3% |
| Immigrants | Congo | 0.1 /100 | #293 | Tragic 5.2% |
| Ghanaians | 0.1 /100 | #294 | Tragic 5.2% |
| Immigrants | Brazil | 0.1 /100 | #295 | Tragic 5.2% |
| Israelis | 0.1 /100 | #296 | Tragic 5.2% |
| Immigrants | Venezuela | 0.1 /100 | #297 | Tragic 5.2% |