Yugoslavian vs Immigrants from Western Asia Male Unemployment
COMPARE
Yugoslavian
Immigrants from Western Asia
Male Unemployment
Male Unemployment Comparison
Yugoslavians
Immigrants from Western Asia
5.0%
MALE UNEMPLOYMENT
98.7/ 100
METRIC RATING
54th/ 347
METRIC RANK
5.6%
MALE UNEMPLOYMENT
3.5/ 100
METRIC RATING
219th/ 347
METRIC RANK
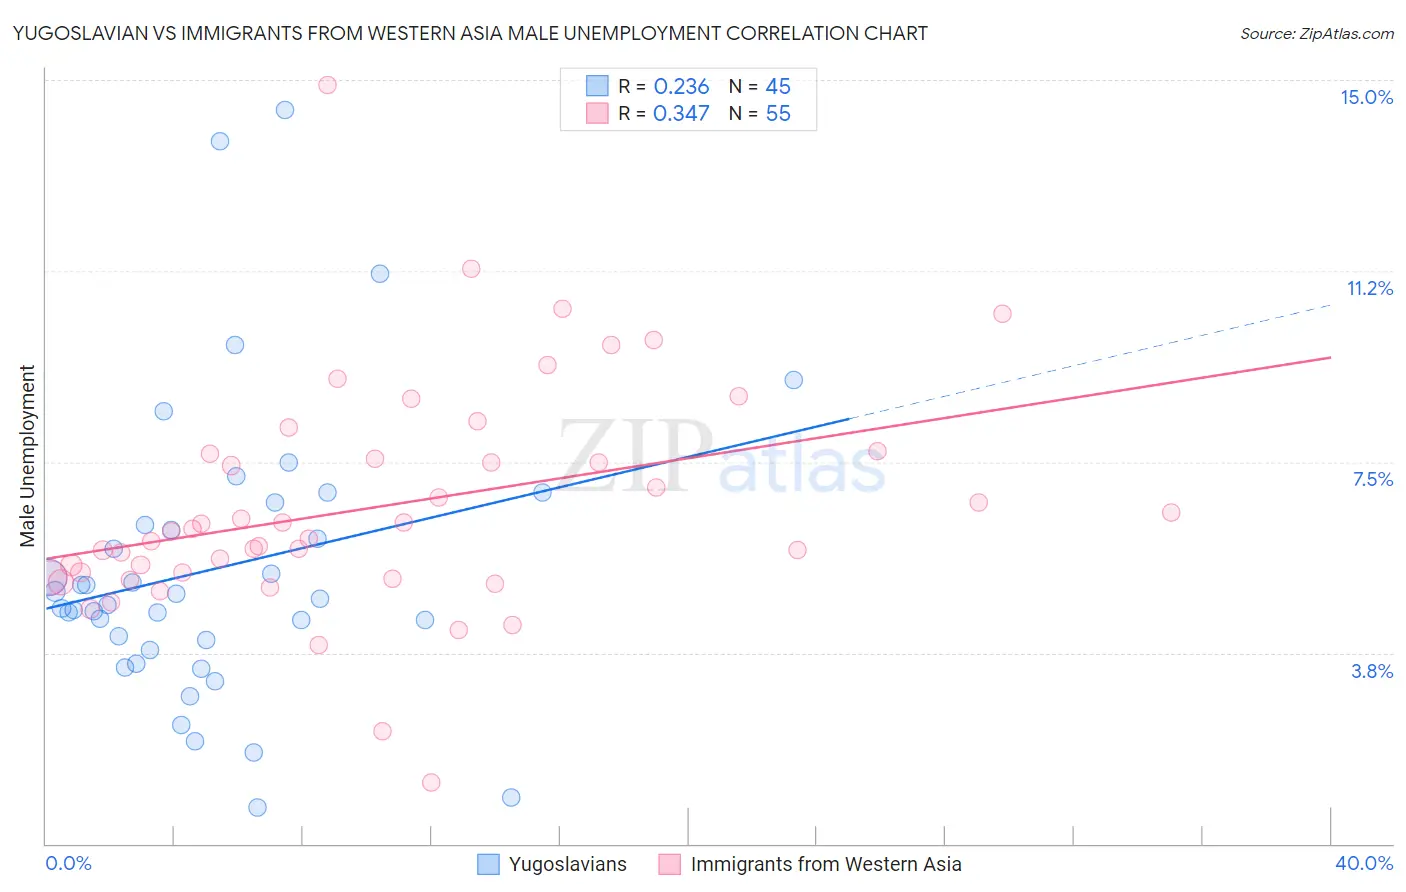
Yugoslavian vs Immigrants from Western Asia Male Unemployment Correlation Chart
The statistical analysis conducted on geographies consisting of 284,881,859 people shows a weak positive correlation between the proportion of Yugoslavians and unemployment rate among males in the United States with a correlation coefficient (R) of 0.236 and weighted average of 5.0%. Similarly, the statistical analysis conducted on geographies consisting of 403,036,222 people shows a mild positive correlation between the proportion of Immigrants from Western Asia and unemployment rate among males in the United States with a correlation coefficient (R) of 0.347 and weighted average of 5.6%, a difference of 11.9%.
Male Unemployment Correlation Summary
| Measurement | Yugoslavian | Immigrants from Western Asia |
| Minimum | 0.70% | 1.2% |
| Maximum | 14.4% | 14.9% |
| Range | 13.7% | 13.7% |
| Mean | 5.4% | 6.6% |
| Median | 4.8% | 6.1% |
| Interquartile 25% (IQ1) | 3.9% | 5.2% |
| Interquartile 75% (IQ3) | 6.5% | 7.6% |
| Interquartile Range (IQR) | 2.6% | 2.4% |
| Standard Deviation (Sample) | 2.8% | 2.3% |
| Standard Deviation (Population) | 2.8% | 2.3% |
Similar Demographics by Male Unemployment
Demographics Similar to Yugoslavians by Male Unemployment
In terms of male unemployment, the demographic groups most similar to Yugoslavians are Czechoslovakian (5.0%, a difference of 0.0%), Immigrants from Bulgaria (5.0%, a difference of 0.010%), Jordanian (5.0%, a difference of 0.10%), Irish (5.0%, a difference of 0.16%), and Slovene (5.0%, a difference of 0.18%).
| Demographics | Rating | Rank | Male Unemployment |
| Austrians | 98.9 /100 | #47 | Exceptional 4.9% |
| Immigrants | Scotland | 98.9 /100 | #48 | Exceptional 4.9% |
| Poles | 98.9 /100 | #49 | Exceptional 4.9% |
| Croatians | 98.9 /100 | #50 | Exceptional 4.9% |
| Slovenes | 98.8 /100 | #51 | Exceptional 5.0% |
| Irish | 98.8 /100 | #52 | Exceptional 5.0% |
| Jordanians | 98.8 /100 | #53 | Exceptional 5.0% |
| Yugoslavians | 98.7 /100 | #54 | Exceptional 5.0% |
| Czechoslovakians | 98.7 /100 | #55 | Exceptional 5.0% |
| Immigrants | Bulgaria | 98.7 /100 | #56 | Exceptional 5.0% |
| Turks | 98.5 /100 | #57 | Exceptional 5.0% |
| Lithuanians | 98.5 /100 | #58 | Exceptional 5.0% |
| Immigrants | Netherlands | 98.3 /100 | #59 | Exceptional 5.0% |
| Immigrants | Argentina | 98.1 /100 | #60 | Exceptional 5.0% |
| Cambodians | 98.1 /100 | #61 | Exceptional 5.0% |
Demographics Similar to Immigrants from Western Asia by Male Unemployment
In terms of male unemployment, the demographic groups most similar to Immigrants from Western Asia are Portuguese (5.6%, a difference of 0.030%), Immigrants from Albania (5.5%, a difference of 0.050%), Soviet Union (5.6%, a difference of 0.13%), Delaware (5.5%, a difference of 0.25%), and Immigrants from Micronesia (5.6%, a difference of 0.27%).
| Demographics | Rating | Rank | Male Unemployment |
| Hmong | 7.0 /100 | #212 | Tragic 5.5% |
| Ugandans | 6.3 /100 | #213 | Tragic 5.5% |
| Puget Sound Salish | 5.6 /100 | #214 | Tragic 5.5% |
| Samoans | 4.9 /100 | #215 | Tragic 5.5% |
| Immigrants | Immigrants | 4.3 /100 | #216 | Tragic 5.5% |
| Delaware | 4.2 /100 | #217 | Tragic 5.5% |
| Immigrants | Albania | 3.6 /100 | #218 | Tragic 5.5% |
| Immigrants | Western Asia | 3.5 /100 | #219 | Tragic 5.6% |
| Portuguese | 3.5 /100 | #220 | Tragic 5.6% |
| Soviet Union | 3.2 /100 | #221 | Tragic 5.6% |
| Immigrants | Micronesia | 2.9 /100 | #222 | Tragic 5.6% |
| Creek | 2.6 /100 | #223 | Tragic 5.6% |
| Cherokee | 2.4 /100 | #224 | Tragic 5.6% |
| Panamanians | 1.9 /100 | #225 | Tragic 5.6% |
| Immigrants | Cambodia | 1.8 /100 | #226 | Tragic 5.6% |