Yakama vs Chippewa Unemployment
COMPARE
Yakama
Chippewa
Unemployment
Unemployment Comparison
Yakama
Chippewa
7.3%
UNEMPLOYMENT
0.0/ 100
METRIC RATING
330th/ 347
METRIC RANK
6.2%
UNEMPLOYMENT
0.0/ 100
METRIC RATING
289th/ 347
METRIC RANK
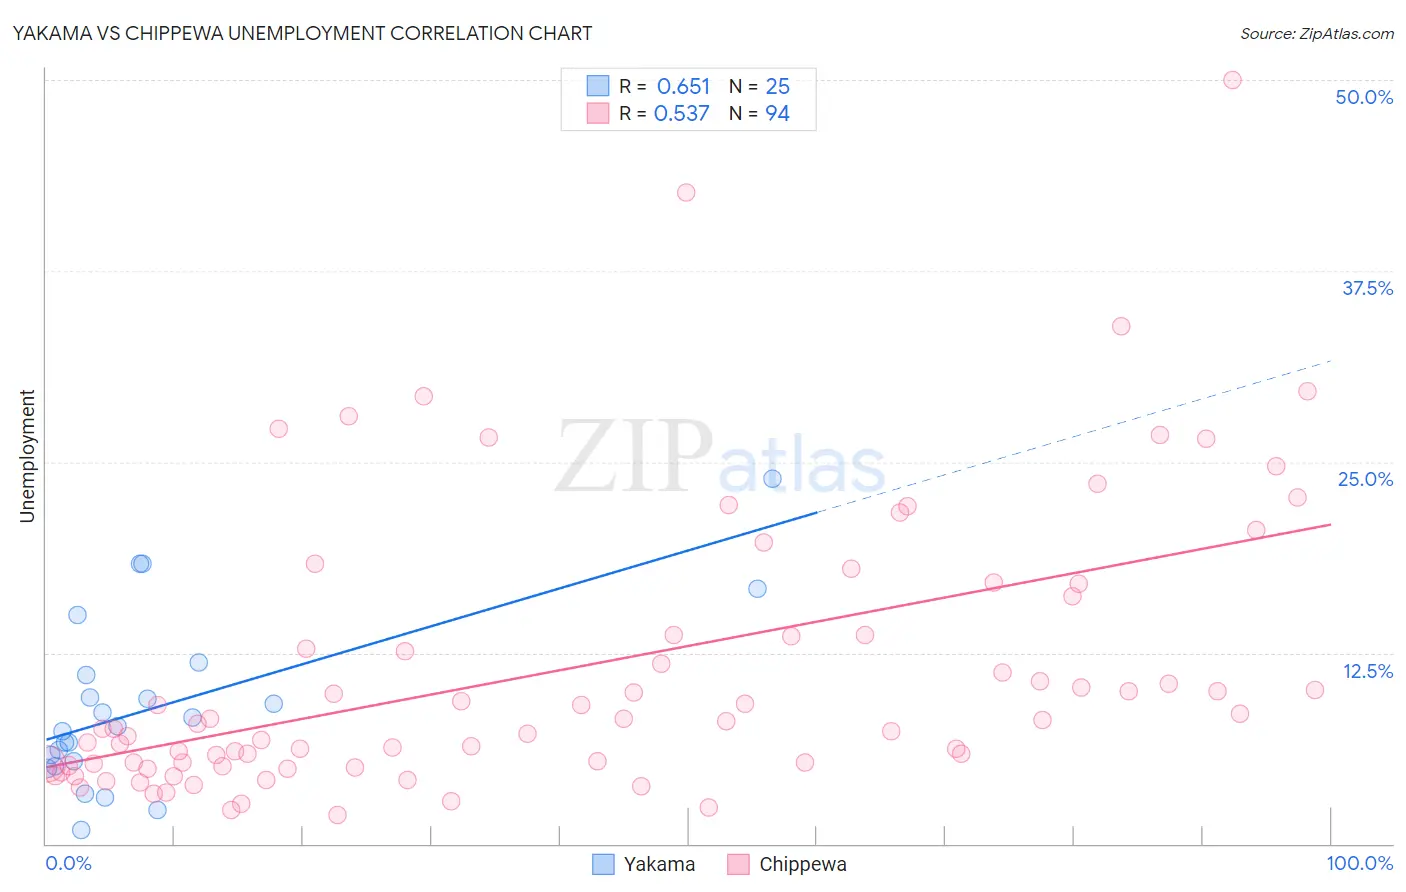
Yakama vs Chippewa Unemployment Correlation Chart
The statistical analysis conducted on geographies consisting of 19,909,925 people shows a significant positive correlation between the proportion of Yakama and unemployment in the United States with a correlation coefficient (R) of 0.651 and weighted average of 7.3%. Similarly, the statistical analysis conducted on geographies consisting of 214,819,653 people shows a substantial positive correlation between the proportion of Chippewa and unemployment in the United States with a correlation coefficient (R) of 0.537 and weighted average of 6.2%, a difference of 18.3%.
Unemployment Correlation Summary
| Measurement | Yakama | Chippewa |
| Minimum | 0.90% | 1.9% |
| Maximum | 23.9% | 50.0% |
| Range | 23.0% | 48.1% |
| Mean | 9.0% | 11.4% |
| Median | 7.7% | 7.9% |
| Interquartile 25% (IQ1) | 5.2% | 5.2% |
| Interquartile 75% (IQ3) | 11.5% | 13.7% |
| Interquartile Range (IQR) | 6.3% | 8.5% |
| Standard Deviation (Sample) | 5.6% | 9.3% |
| Standard Deviation (Population) | 5.5% | 9.2% |
Similar Demographics by Unemployment
Demographics Similar to Yakama by Unemployment
In terms of unemployment, the demographic groups most similar to Yakama are Dominican (7.4%, a difference of 0.33%), Sioux (7.4%, a difference of 0.76%), Immigrants from Dominican Republic (7.4%, a difference of 0.82%), Alaska Native (7.2%, a difference of 1.3%), and Apache (7.4%, a difference of 1.3%).
| Demographics | Rating | Rank | Unemployment |
| Immigrants | Grenada | 0.0 /100 | #323 | Tragic 6.9% |
| Immigrants | Armenia | 0.0 /100 | #324 | Tragic 7.0% |
| Natives/Alaskans | 0.0 /100 | #325 | Tragic 7.0% |
| Paiute | 0.0 /100 | #326 | Tragic 7.1% |
| Pueblo | 0.0 /100 | #327 | Tragic 7.2% |
| Tsimshian | 0.0 /100 | #328 | Tragic 7.2% |
| Alaska Natives | 0.0 /100 | #329 | Tragic 7.2% |
| Yakama | 0.0 /100 | #330 | Tragic 7.3% |
| Dominicans | 0.0 /100 | #331 | Tragic 7.4% |
| Sioux | 0.0 /100 | #332 | Tragic 7.4% |
| Immigrants | Dominican Republic | 0.0 /100 | #333 | Tragic 7.4% |
| Apache | 0.0 /100 | #334 | Tragic 7.4% |
| Alaskan Athabascans | 0.0 /100 | #335 | Tragic 7.7% |
| Immigrants | Yemen | 0.0 /100 | #336 | Tragic 7.7% |
| Cheyenne | 0.0 /100 | #337 | Tragic 8.0% |
Demographics Similar to Chippewa by Unemployment
In terms of unemployment, the demographic groups most similar to Chippewa are Senegalese (6.2%, a difference of 0.090%), Ecuadorian (6.2%, a difference of 0.35%), Nepalese (6.2%, a difference of 0.38%), Haitian (6.2%, a difference of 0.62%), and Central American Indian (6.2%, a difference of 0.64%).
| Demographics | Rating | Rank | Unemployment |
| Immigrants | Azores | 0.0 /100 | #282 | Tragic 6.1% |
| Immigrants | Ghana | 0.0 /100 | #283 | Tragic 6.1% |
| Aleuts | 0.0 /100 | #284 | Tragic 6.1% |
| Immigrants | Senegal | 0.0 /100 | #285 | Tragic 6.1% |
| Immigrants | Caribbean | 0.0 /100 | #286 | Tragic 6.2% |
| Nepalese | 0.0 /100 | #287 | Tragic 6.2% |
| Ecuadorians | 0.0 /100 | #288 | Tragic 6.2% |
| Chippewa | 0.0 /100 | #289 | Tragic 6.2% |
| Senegalese | 0.0 /100 | #290 | Tragic 6.2% |
| Haitians | 0.0 /100 | #291 | Tragic 6.2% |
| Central American Indians | 0.0 /100 | #292 | Tragic 6.2% |
| Immigrants | Ecuador | 0.0 /100 | #293 | Tragic 6.2% |
| Spanish American Indians | 0.0 /100 | #294 | Tragic 6.2% |
| U.S. Virgin Islanders | 0.0 /100 | #295 | Tragic 6.3% |
| Ute | 0.0 /100 | #296 | Tragic 6.3% |