Yakama vs Immigrants from Western Asia Unemployment
COMPARE
Yakama
Immigrants from Western Asia
Unemployment
Unemployment Comparison
Yakama
Immigrants from Western Asia
7.3%
UNEMPLOYMENT
0.0/ 100
METRIC RATING
330th/ 347
METRIC RANK
5.5%
UNEMPLOYMENT
2.8/ 100
METRIC RATING
238th/ 347
METRIC RANK
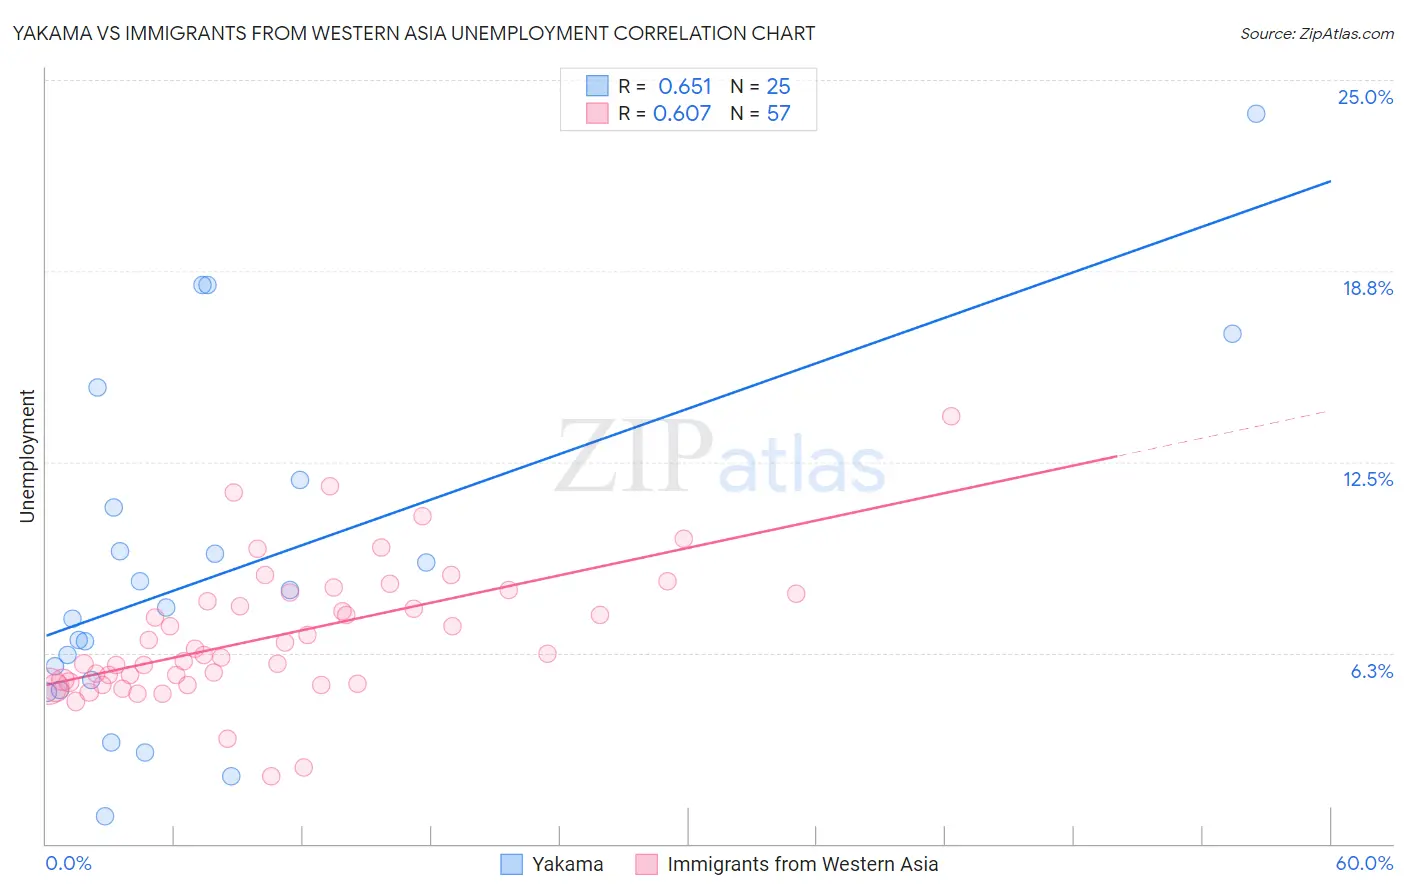
Yakama vs Immigrants from Western Asia Unemployment Correlation Chart
The statistical analysis conducted on geographies consisting of 19,909,925 people shows a significant positive correlation between the proportion of Yakama and unemployment in the United States with a correlation coefficient (R) of 0.651 and weighted average of 7.3%. Similarly, the statistical analysis conducted on geographies consisting of 404,185,232 people shows a significant positive correlation between the proportion of Immigrants from Western Asia and unemployment in the United States with a correlation coefficient (R) of 0.607 and weighted average of 5.5%, a difference of 32.2%.
Unemployment Correlation Summary
| Measurement | Yakama | Immigrants from Western Asia |
| Minimum | 0.90% | 2.2% |
| Maximum | 23.9% | 14.0% |
| Range | 23.0% | 11.8% |
| Mean | 9.0% | 6.8% |
| Median | 7.7% | 6.2% |
| Interquartile 25% (IQ1) | 5.2% | 5.3% |
| Interquartile 75% (IQ3) | 11.5% | 8.2% |
| Interquartile Range (IQR) | 6.3% | 2.9% |
| Standard Deviation (Sample) | 5.6% | 2.2% |
| Standard Deviation (Population) | 5.5% | 2.2% |
Similar Demographics by Unemployment
Demographics Similar to Yakama by Unemployment
In terms of unemployment, the demographic groups most similar to Yakama are Dominican (7.4%, a difference of 0.33%), Sioux (7.4%, a difference of 0.76%), Immigrants from Dominican Republic (7.4%, a difference of 0.82%), Alaska Native (7.2%, a difference of 1.3%), and Apache (7.4%, a difference of 1.3%).
| Demographics | Rating | Rank | Unemployment |
| Immigrants | Grenada | 0.0 /100 | #323 | Tragic 6.9% |
| Immigrants | Armenia | 0.0 /100 | #324 | Tragic 7.0% |
| Natives/Alaskans | 0.0 /100 | #325 | Tragic 7.0% |
| Paiute | 0.0 /100 | #326 | Tragic 7.1% |
| Pueblo | 0.0 /100 | #327 | Tragic 7.2% |
| Tsimshian | 0.0 /100 | #328 | Tragic 7.2% |
| Alaska Natives | 0.0 /100 | #329 | Tragic 7.2% |
| Yakama | 0.0 /100 | #330 | Tragic 7.3% |
| Dominicans | 0.0 /100 | #331 | Tragic 7.4% |
| Sioux | 0.0 /100 | #332 | Tragic 7.4% |
| Immigrants | Dominican Republic | 0.0 /100 | #333 | Tragic 7.4% |
| Apache | 0.0 /100 | #334 | Tragic 7.4% |
| Alaskan Athabascans | 0.0 /100 | #335 | Tragic 7.7% |
| Immigrants | Yemen | 0.0 /100 | #336 | Tragic 7.7% |
| Cheyenne | 0.0 /100 | #337 | Tragic 8.0% |
Demographics Similar to Immigrants from Western Asia by Unemployment
In terms of unemployment, the demographic groups most similar to Immigrants from Western Asia are Immigrants (5.5%, a difference of 0.090%), Cree (5.6%, a difference of 0.10%), Moroccan (5.5%, a difference of 0.21%), Immigrants from Cambodia (5.5%, a difference of 0.27%), and Immigrants from Panama (5.5%, a difference of 0.30%).
| Demographics | Rating | Rank | Unemployment |
| Immigrants | Africa | 4.9 /100 | #231 | Tragic 5.5% |
| Comanche | 4.9 /100 | #232 | Tragic 5.5% |
| Immigrants | Syria | 4.8 /100 | #233 | Tragic 5.5% |
| Panamanians | 4.7 /100 | #234 | Tragic 5.5% |
| Immigrants | Panama | 3.4 /100 | #235 | Tragic 5.5% |
| Immigrants | Cambodia | 3.3 /100 | #236 | Tragic 5.5% |
| Moroccans | 3.2 /100 | #237 | Tragic 5.5% |
| Immigrants | Western Asia | 2.8 /100 | #238 | Tragic 5.5% |
| Immigrants | Immigrants | 2.6 /100 | #239 | Tragic 5.5% |
| Cree | 2.6 /100 | #240 | Tragic 5.6% |
| Tlingit-Haida | 2.0 /100 | #241 | Tragic 5.6% |
| Spanish Americans | 2.0 /100 | #242 | Tragic 5.6% |
| Marshallese | 1.3 /100 | #243 | Tragic 5.6% |
| Dutch West Indians | 1.2 /100 | #244 | Tragic 5.6% |
| French American Indians | 1.2 /100 | #245 | Tragic 5.6% |