Immigrants from Cuba vs Chippewa Unemployment
COMPARE
Immigrants from Cuba
Chippewa
Unemployment
Unemployment Comparison
Immigrants from Cuba
Chippewa
4.6%
UNEMPLOYMENT
100.0/ 100
METRIC RATING
14th/ 347
METRIC RANK
6.2%
UNEMPLOYMENT
0.0/ 100
METRIC RATING
289th/ 347
METRIC RANK
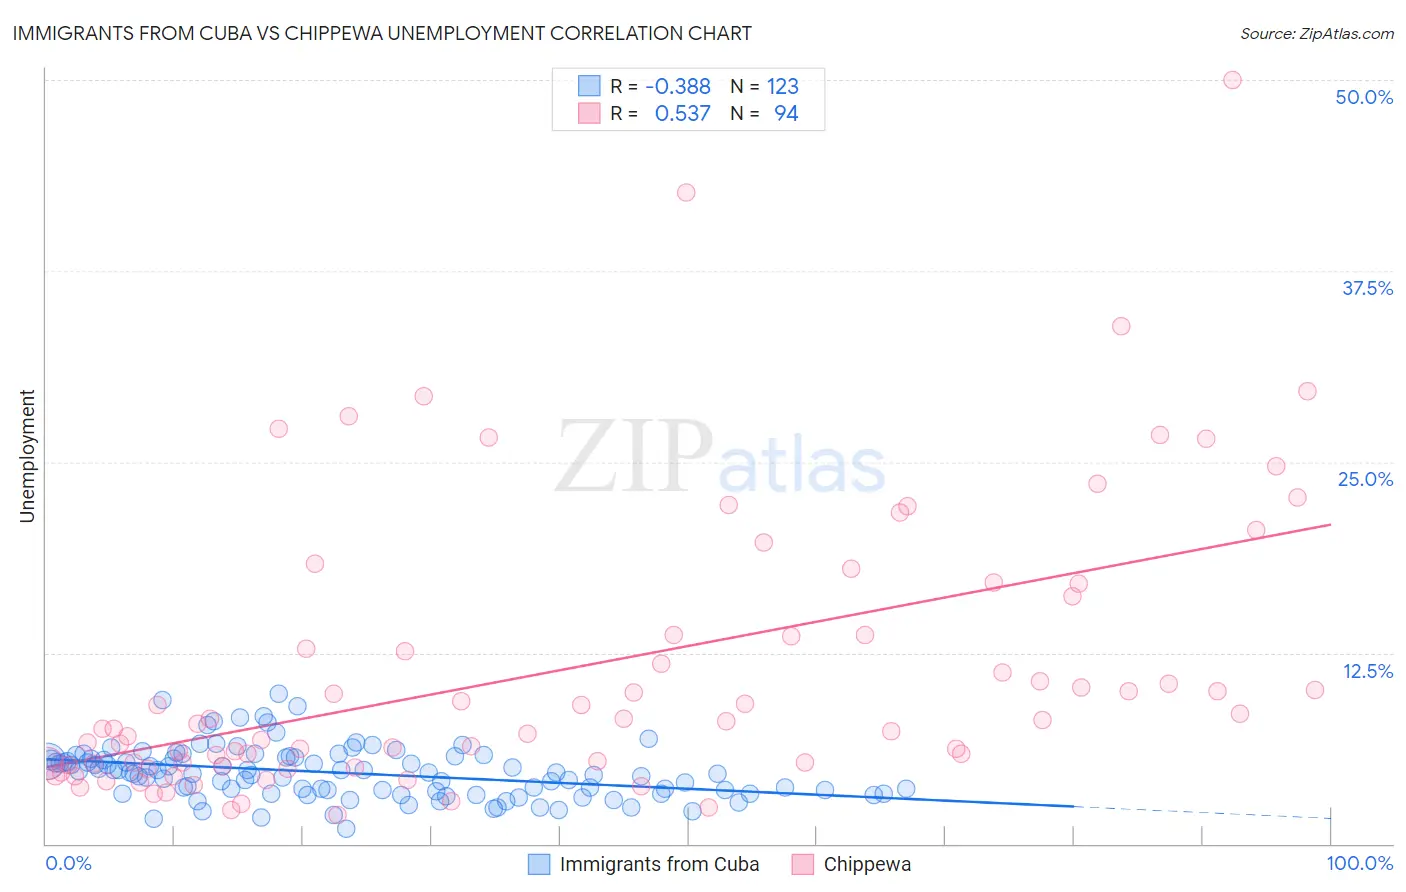
Immigrants from Cuba vs Chippewa Unemployment Correlation Chart
The statistical analysis conducted on geographies consisting of 325,813,877 people shows a mild negative correlation between the proportion of Immigrants from Cuba and unemployment in the United States with a correlation coefficient (R) of -0.388 and weighted average of 4.6%. Similarly, the statistical analysis conducted on geographies consisting of 214,819,653 people shows a substantial positive correlation between the proportion of Chippewa and unemployment in the United States with a correlation coefficient (R) of 0.537 and weighted average of 6.2%, a difference of 34.0%.
Unemployment Correlation Summary
| Measurement | Immigrants from Cuba | Chippewa |
| Minimum | 1.0% | 1.9% |
| Maximum | 9.8% | 50.0% |
| Range | 8.8% | 48.1% |
| Mean | 4.6% | 11.4% |
| Median | 4.7% | 7.9% |
| Interquartile 25% (IQ1) | 3.4% | 5.2% |
| Interquartile 75% (IQ3) | 5.6% | 13.7% |
| Interquartile Range (IQR) | 2.2% | 8.5% |
| Standard Deviation (Sample) | 1.7% | 9.3% |
| Standard Deviation (Population) | 1.7% | 9.2% |
Similar Demographics by Unemployment
Demographics Similar to Immigrants from Cuba by Unemployment
In terms of unemployment, the demographic groups most similar to Immigrants from Cuba are Belgian (4.6%, a difference of 0.24%), Pennsylvania German (4.6%, a difference of 0.40%), European (4.6%, a difference of 0.48%), English (4.6%, a difference of 0.50%), and Chinese (4.7%, a difference of 0.62%).
| Demographics | Rating | Rank | Unemployment |
| Immigrants | India | 100.0 /100 | #7 | Exceptional 4.5% |
| Swiss | 100.0 /100 | #8 | Exceptional 4.5% |
| Scandinavians | 100.0 /100 | #9 | Exceptional 4.5% |
| Dutch | 100.0 /100 | #10 | Exceptional 4.6% |
| English | 100.0 /100 | #11 | Exceptional 4.6% |
| Pennsylvania Germans | 100.0 /100 | #12 | Exceptional 4.6% |
| Belgians | 100.0 /100 | #13 | Exceptional 4.6% |
| Immigrants | Cuba | 100.0 /100 | #14 | Exceptional 4.6% |
| Europeans | 99.9 /100 | #15 | Exceptional 4.6% |
| Chinese | 99.9 /100 | #16 | Exceptional 4.7% |
| Slovenes | 99.9 /100 | #17 | Exceptional 4.7% |
| Immigrants | Venezuela | 99.9 /100 | #18 | Exceptional 4.7% |
| Scottish | 99.9 /100 | #19 | Exceptional 4.7% |
| Carpatho Rusyns | 99.9 /100 | #20 | Exceptional 4.7% |
| Welsh | 99.9 /100 | #21 | Exceptional 4.7% |
Demographics Similar to Chippewa by Unemployment
In terms of unemployment, the demographic groups most similar to Chippewa are Senegalese (6.2%, a difference of 0.090%), Ecuadorian (6.2%, a difference of 0.35%), Nepalese (6.2%, a difference of 0.38%), Haitian (6.2%, a difference of 0.62%), and Central American Indian (6.2%, a difference of 0.64%).
| Demographics | Rating | Rank | Unemployment |
| Immigrants | Azores | 0.0 /100 | #282 | Tragic 6.1% |
| Immigrants | Ghana | 0.0 /100 | #283 | Tragic 6.1% |
| Aleuts | 0.0 /100 | #284 | Tragic 6.1% |
| Immigrants | Senegal | 0.0 /100 | #285 | Tragic 6.1% |
| Immigrants | Caribbean | 0.0 /100 | #286 | Tragic 6.2% |
| Nepalese | 0.0 /100 | #287 | Tragic 6.2% |
| Ecuadorians | 0.0 /100 | #288 | Tragic 6.2% |
| Chippewa | 0.0 /100 | #289 | Tragic 6.2% |
| Senegalese | 0.0 /100 | #290 | Tragic 6.2% |
| Haitians | 0.0 /100 | #291 | Tragic 6.2% |
| Central American Indians | 0.0 /100 | #292 | Tragic 6.2% |
| Immigrants | Ecuador | 0.0 /100 | #293 | Tragic 6.2% |
| Spanish American Indians | 0.0 /100 | #294 | Tragic 6.2% |
| U.S. Virgin Islanders | 0.0 /100 | #295 | Tragic 6.3% |
| Ute | 0.0 /100 | #296 | Tragic 6.3% |