Lebanese vs Chippewa Unemployment

COMPARE

Lebanese
Race
Ancestry
AfghanAfricanAlaska NativeAlaskan AthabascanAlbanianAleutAlsatianAmericanApacheArabArapahoArgentineanArmenianAssyrian/Chaldean/SyriacAustralianAustrianBahamianBangladeshiBarbadianBasqueBelgianBelizeanBermudanBhutaneseBlackfeetBolivianBrazilianBritishBritish West IndianBulgarianBurmeseCajunCambodianCanadianCape VerdeanCarpatho RusynCelticCentral AmericanCentral American IndianCherokeeCheyenneChickasawChileanChineseChoctawColombianColvilleComancheCosta RicanCreeCreekCroatianCrowCubanCypriotCzechCzechoslovakianDanishDelawareDominicanDutchDutch West IndianEastern EuropeanEcuadorianEgyptianEnglishEstonianEthiopianEuropeanFijianFilipinoFinnishFrenchFrench American IndianFrench CanadianGermanGerman RussianGhanaianGreekGuamanian/ChamorroGuatemalanGuyaneseHaitianHmongHonduranHopiHoumaHungarianIcelanderIndian (Asian)IndonesianInupiatIranianIraqiIrishIroquoisIsraeliItalianJamaicanJapaneseJordanianKenyanKiowaKoreanLaotianLatvianLebaneseLiberianLithuanianLumbeeLuxembourgerMacedonianMalaysianMalteseMarshalleseMenomineeMexicanMexican American IndianMongolianMoroccanNative HawaiianNavajoNepaleseNew ZealanderNicaraguanNigerianNorthern EuropeanNorwegianOkinawanOsageOttawaPaiutePakistaniPalestinianPanamanianParaguayanPennsylvania GermanPeruvianPimaPolishPortuguesePotawatomiPuebloPuerto RicanPuget Sound SalishRomanianRussianSalvadoranSamoanScandinavianScotch-IrishScottishSeminoleSenegaleseSerbianShoshoneSierra LeoneanSiouxSlavicSlovakSloveneSomaliSouth AfricanSouth AmericanSouth American IndianSoviet UnionSpaniardSpanishSpanish AmericanSpanish American IndianSri LankanSubsaharan AfricanSudaneseSwedishSwissSyrianTaiwaneseThaiTlingit-HaidaTohono O'OdhamTonganTrinidadian and TobagonianTsimshianTurkishU.S. Virgin IslanderUgandanUkrainianUruguayanUteVenezuelanVietnameseWelshWest IndianYakamaYaquiYugoslavianYumanYup'ikZimbabwean
Immigration
NonimmigrantsImmigrantsAfghanistanAfricaAlbaniaArgentinaArmeniaAsiaAustraliaAustriaBahamasBangladeshBarbadosBelarusBelgiumBelizeBoliviaBosnia and HerzegovinaBrazilBulgariaBurma/MyanmarCabo VerdeCambodiaCameroonCanadaCaribbeanCentral AmericaChileChinaColombiaCongoCosta RicaCroatiaCubaCzechoslovakiaDenmarkDominicaDominican RepublicEastern AfricaEastern AsiaEastern EuropeEcuadorEgyptEl SalvadorEnglandEritreaEthiopiaEuropeFijiFranceGermanyGhanaGreeceGrenadaGuatemalaGuyanaHaitiHondurasHong KongHungaryIndiaIndonesiaIranIraqIrelandIsraelItalyJamaicaJapanJordanKazakhstanKenyaKoreaKuwaitLaosLatin AmericaLatviaLebanonLiberiaLithuaniaMalaysiaMexicoMicronesiaMiddle AfricaMoldovaMoroccoNepalNetherlandsNicaraguaNigeriaNorth AmericaNorth MacedoniaNorthern AfricaNorthern EuropeNorwayOceaniaPakistanPanamaPeruPhilippinesPolandPortugalRomaniaRussiaSaudi ArabiaScotlandSenegalSerbiaSierra LeoneSingaporeSomaliaSouth AfricaSouth AmericaSouth Central AsiaSouth Eastern AsiaSouthern EuropeSpainSri LankaSt. Vincent and the GrenadinesSudanSwedenSwitzerlandSyriaTaiwanThailandTrinidad and TobagoTurkeyUgandaUkraineUruguayUzbekistanVenezuelaVietnamWest IndiesWestern AfricaWestern AsiaWestern EuropeYemenZaireZimbabweAzores
Chippewa
Race
Ancestry
AfghanAfricanAlaska NativeAlaskan AthabascanAlbanianAleutAlsatianAmericanApacheArabArapahoArgentineanArmenianAssyrian/Chaldean/SyriacAustralianAustrianBahamianBangladeshiBarbadianBasqueBelgianBelizeanBermudanBhutaneseBlackfeetBolivianBrazilianBritishBritish West IndianBulgarianBurmeseCajunCambodianCanadianCape VerdeanCarpatho RusynCelticCentral AmericanCentral American IndianCherokeeCheyenneChickasawChileanChineseChippewaChoctawColombianColvilleComancheCosta RicanCreeCreekCroatianCrowCubanCypriotCzechCzechoslovakianDanishDelawareDominicanDutchDutch West IndianEastern EuropeanEcuadorianEgyptianEnglishEstonianEthiopianEuropeanFijianFilipinoFinnishFrenchFrench American IndianFrench CanadianGermanGerman RussianGhanaianGreekGuamanian/ChamorroGuatemalanGuyaneseHaitianHmongHonduranHopiHoumaHungarianIcelanderIndian (Asian)IndonesianInupiatIranianIraqiIrishIroquoisIsraeliItalianJamaicanJapaneseJordanianKenyanKiowaKoreanLaotianLatvianLiberianLithuanianLumbeeLuxembourgerMacedonianMalaysianMalteseMarshalleseMenomineeMexicanMexican American IndianMongolianMoroccanNative HawaiianNavajoNepaleseNew ZealanderNicaraguanNigerianNorthern EuropeanNorwegianOkinawanOsageOttawaPaiutePakistaniPalestinianPanamanianParaguayanPennsylvania GermanPeruvianPimaPolishPortuguesePotawatomiPuebloPuerto RicanPuget Sound SalishRomanianRussianSalvadoranSamoanScandinavianScotch-IrishScottishSeminoleSenegaleseSerbianShoshoneSierra LeoneanSiouxSlavicSlovakSloveneSomaliSouth AfricanSouth AmericanSouth American IndianSoviet UnionSpaniardSpanishSpanish AmericanSpanish American IndianSri LankanSubsaharan AfricanSudaneseSwedishSwissSyrianTaiwaneseThaiTlingit-HaidaTohono O'OdhamTonganTrinidadian and TobagonianTsimshianTurkishU.S. Virgin IslanderUgandanUkrainianUruguayanUteVenezuelanVietnameseWelshWest IndianYakamaYaquiYugoslavianYumanYup'ikZimbabwean
Immigration
NonimmigrantsImmigrantsAfghanistanAfricaAlbaniaArgentinaArmeniaAsiaAustraliaAustriaBahamasBangladeshBarbadosBelarusBelgiumBelizeBoliviaBosnia and HerzegovinaBrazilBulgariaBurma/MyanmarCabo VerdeCambodiaCameroonCanadaCaribbeanCentral AmericaChileChinaColombiaCongoCosta RicaCroatiaCubaCzechoslovakiaDenmarkDominicaDominican RepublicEastern AfricaEastern AsiaEastern EuropeEcuadorEgyptEl SalvadorEnglandEritreaEthiopiaEuropeFijiFranceGermanyGhanaGreeceGrenadaGuatemalaGuyanaHaitiHondurasHong KongHungaryIndiaIndonesiaIranIraqIrelandIsraelItalyJamaicaJapanJordanKazakhstanKenyaKoreaKuwaitLaosLatin AmericaLatviaLebanonLiberiaLithuaniaMalaysiaMexicoMicronesiaMiddle AfricaMoldovaMoroccoNepalNetherlandsNicaraguaNigeriaNorth AmericaNorth MacedoniaNorthern AfricaNorthern EuropeNorwayOceaniaPakistanPanamaPeruPhilippinesPolandPortugalRomaniaRussiaSaudi ArabiaScotlandSenegalSerbiaSierra LeoneSingaporeSomaliaSouth AfricaSouth AmericaSouth Central AsiaSouth Eastern AsiaSouthern EuropeSpainSri LankaSt. Vincent and the GrenadinesSudanSwedenSwitzerlandSyriaTaiwanThailandTrinidad and TobagoTurkeyUgandaUkraineUruguayUzbekistanVenezuelaVietnamWest IndiesWestern AfricaWestern AsiaWestern EuropeYemenZaireZimbabweAzores
Unemployment
Income
Poverty
Unemployment
Labor Participation
Family Structure
Vehicle Availability
Education Level
Disability

Unemployment Comparison

Lebanese

Chippewa

Excellent
Tragic
5.1%
UNEMPLOYMENT
89.2/ 100
METRIC RATING
121st/ 347
METRIC RANK
6.2%
UNEMPLOYMENT
0.0/ 100
METRIC RATING
289th/ 347
METRIC RANK

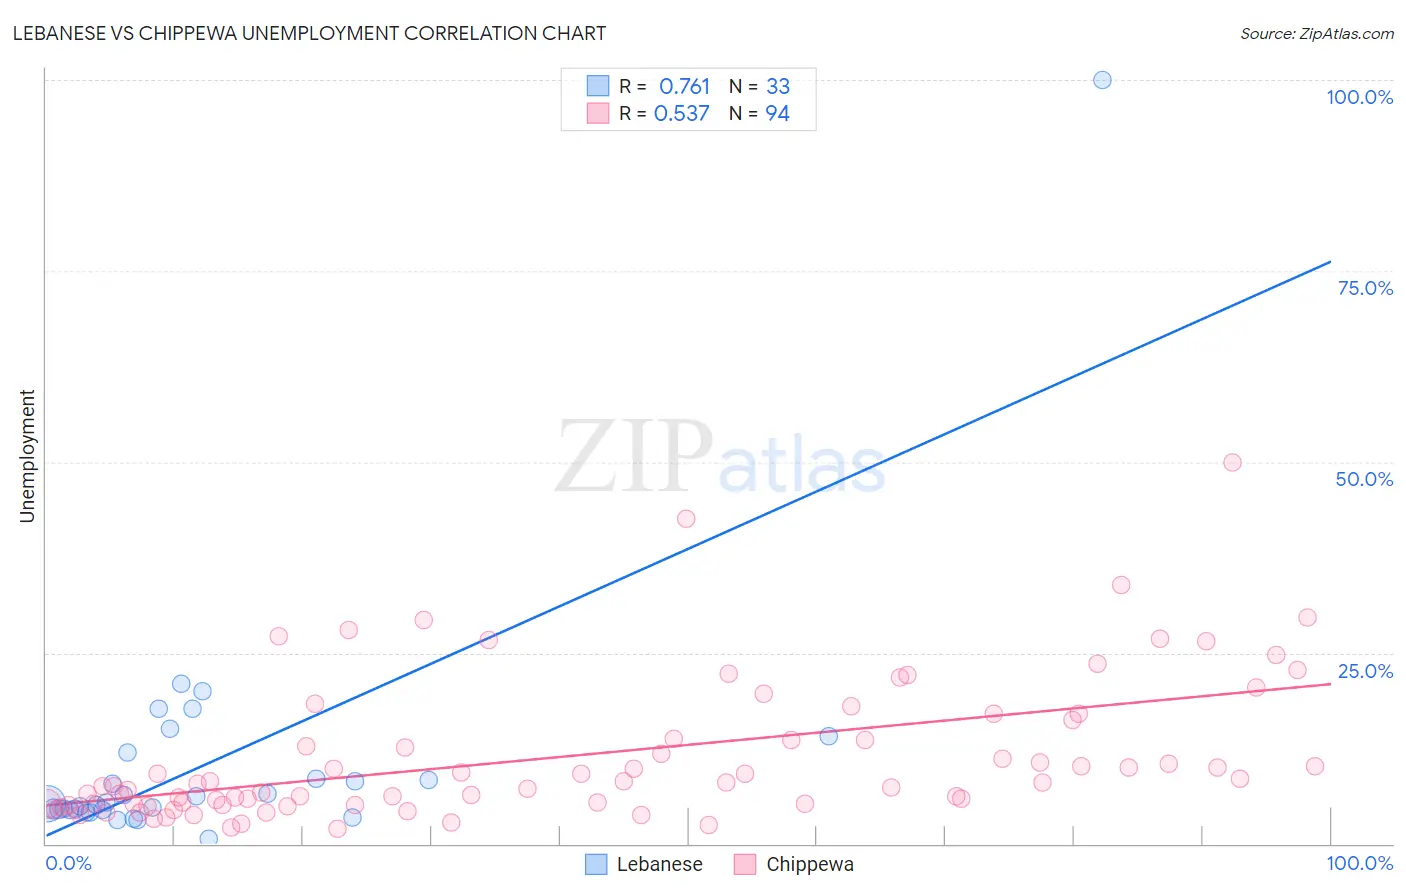
Lebanese vs Chippewa Unemployment Correlation Chart

The statistical analysis conducted on geographies consisting of 401,244,101 people shows a strong positive correlation between the proportion of Lebanese and unemployment in the United States with a correlation coefficient (R) of 0.761 and weighted average of 5.1%. Similarly, the statistical analysis conducted on geographies consisting of 214,819,653 people shows a substantial positive correlation between the proportion of Chippewa and unemployment in the United States with a correlation coefficient (R) of 0.537 and weighted average of 6.2%, a difference of 21.8%.
Lebanese vs Chippewa Unemployment

Unemployment Correlation Summary

MeasurementLebaneseChippewa
Minimum0.70%1.9%
Maximum100.0%50.0%
Range99.3%48.1%
Mean10.4%11.4%
Median5.2%7.9%
Interquartile 25% (IQ1)4.4%5.2%
Interquartile 75% (IQ3)10.2%13.7%
Interquartile Range (IQR)5.8%8.5%
Standard Deviation (Sample)16.9%9.3%
Standard Deviation (Population)16.7%9.2%

Similar Demographics by Unemployment

Demographics Similar to Lebanese by Unemployment

In terms of unemployment, the demographic groups most similar to Lebanese are Immigrants from Switzerland (5.1%, a difference of 0.020%), Asian (5.1%, a difference of 0.040%), Macedonian (5.1%, a difference of 0.070%), Immigrants from France (5.1%, a difference of 0.080%), and Ethiopian (5.1%, a difference of 0.090%).
DemographicsRating | RankUnemployment
Immigrants | Ireland
92.1
/100
|
#114
Exceptional
5.1%
Immigrants | Western Europe
91.1
/100
|
#115
Exceptional
5.1%
Immigrants | Sri Lanka
91.1
/100
|
#116
Exceptional
5.1%
Immigrants | Malaysia
91.0
/100
|
#117
Exceptional
5.1%
Immigrants | Germany
90.8
/100
|
#118
Exceptional
5.1%
Immigrants | France
89.7
/100
|
#119
Excellent
5.1%
Macedonians
89.7
/100
|
#120
Excellent
5.1%
Lebanese
89.2
/100
|
#121
Excellent
5.1%
Immigrants | Switzerland
89.1
/100
|
#122
Excellent
5.1%
Asians
89.0
/100
|
#123
Excellent
5.1%
Ethiopians
88.6
/100
|
#124
Excellent
5.1%
Immigrants | Eastern Asia
88.3
/100
|
#125
Excellent
5.1%
Kenyans
88.2
/100
|
#126
Excellent
5.1%
Immigrants | Kenya
88.2
/100
|
#127
Excellent
5.1%
Immigrants | Eastern Africa
88.1
/100
|
#128
Excellent
5.1%

Demographics Similar to Chippewa by Unemployment

In terms of unemployment, the demographic groups most similar to Chippewa are Senegalese (6.2%, a difference of 0.090%), Ecuadorian (6.2%, a difference of 0.35%), Nepalese (6.2%, a difference of 0.38%), Haitian (6.2%, a difference of 0.62%), and Central American Indian (6.2%, a difference of 0.64%).
DemographicsRating | RankUnemployment
Immigrants | Azores
0.0
/100
|
#282
Tragic
6.1%
Immigrants | Ghana
0.0
/100
|
#283
Tragic
6.1%
Aleuts
0.0
/100
|
#284
Tragic
6.1%
Immigrants | Senegal
0.0
/100
|
#285
Tragic
6.1%
Immigrants | Caribbean
0.0
/100
|
#286
Tragic
6.2%
Nepalese
0.0
/100
|
#287
Tragic
6.2%
Ecuadorians
0.0
/100
|
#288
Tragic
6.2%
Chippewa
0.0
/100
|
#289
Tragic
6.2%
Senegalese
0.0
/100
|
#290
Tragic
6.2%
Haitians
0.0
/100
|
#291
Tragic
6.2%
Central American Indians
0.0
/100
|
#292
Tragic
6.2%
Immigrants | Ecuador
0.0
/100
|
#293
Tragic
6.2%
Spanish American Indians
0.0
/100
|
#294
Tragic
6.2%
U.S. Virgin Islanders
0.0
/100
|
#295
Tragic
6.3%
Ute
0.0
/100
|
#296
Tragic
6.3%