Immigrants from South Central Asia vs Chippewa Unemployment
COMPARE
Immigrants from South Central Asia
Chippewa
Unemployment
Unemployment Comparison
Immigrants from South Central Asia
Chippewa
4.9%
UNEMPLOYMENT
99.3/ 100
METRIC RATING
49th/ 347
METRIC RANK
6.2%
UNEMPLOYMENT
0.0/ 100
METRIC RATING
289th/ 347
METRIC RANK
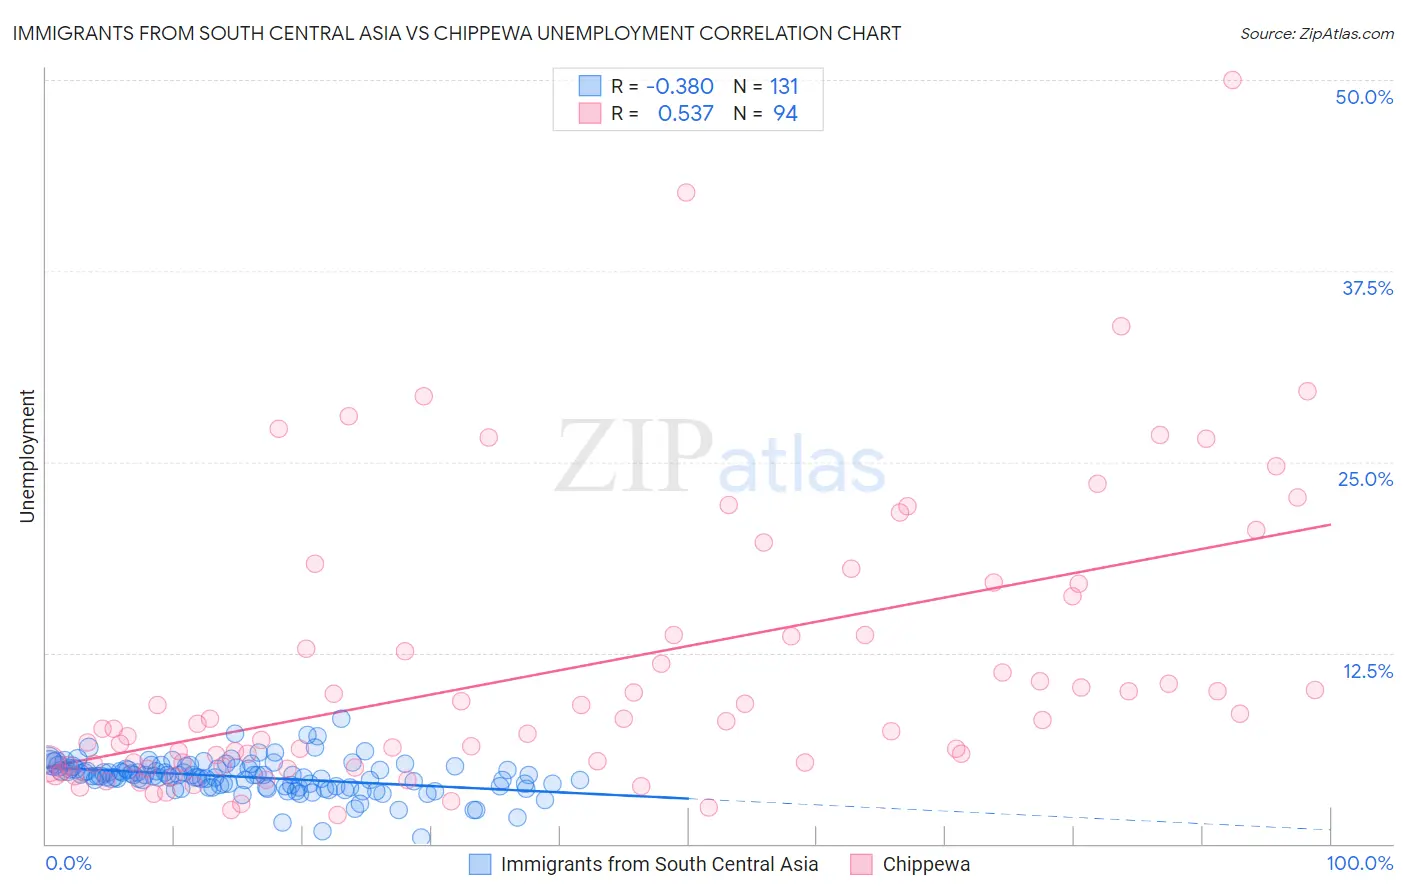
Immigrants from South Central Asia vs Chippewa Unemployment Correlation Chart
The statistical analysis conducted on geographies consisting of 472,428,090 people shows a mild negative correlation between the proportion of Immigrants from South Central Asia and unemployment in the United States with a correlation coefficient (R) of -0.380 and weighted average of 4.9%. Similarly, the statistical analysis conducted on geographies consisting of 214,819,653 people shows a substantial positive correlation between the proportion of Chippewa and unemployment in the United States with a correlation coefficient (R) of 0.537 and weighted average of 6.2%, a difference of 27.6%.
Unemployment Correlation Summary
| Measurement | Immigrants from South Central Asia | Chippewa |
| Minimum | 0.40% | 1.9% |
| Maximum | 8.2% | 50.0% |
| Range | 7.8% | 48.1% |
| Mean | 4.4% | 11.4% |
| Median | 4.4% | 7.9% |
| Interquartile 25% (IQ1) | 3.8% | 5.2% |
| Interquartile 75% (IQ3) | 4.9% | 13.7% |
| Interquartile Range (IQR) | 1.2% | 8.5% |
| Standard Deviation (Sample) | 1.1% | 9.3% |
| Standard Deviation (Population) | 1.1% | 9.2% |
Similar Demographics by Unemployment
Demographics Similar to Immigrants from South Central Asia by Unemployment
In terms of unemployment, the demographic groups most similar to Immigrants from South Central Asia are Immigrants from Scotland (4.9%, a difference of 0.010%), French Canadian (4.9%, a difference of 0.020%), Immigrants from Belgium (4.9%, a difference of 0.18%), White/Caucasian (4.9%, a difference of 0.19%), and Immigrants from Taiwan (4.8%, a difference of 0.22%).
| Demographics | Rating | Rank | Unemployment |
| Filipinos | 99.5 /100 | #42 | Exceptional 4.8% |
| Yugoslavians | 99.5 /100 | #43 | Exceptional 4.8% |
| Austrians | 99.5 /100 | #44 | Exceptional 4.8% |
| French | 99.5 /100 | #45 | Exceptional 4.8% |
| Immigrants | Nepal | 99.4 /100 | #46 | Exceptional 4.8% |
| Immigrants | Taiwan | 99.4 /100 | #47 | Exceptional 4.8% |
| Immigrants | Scotland | 99.3 /100 | #48 | Exceptional 4.9% |
| Immigrants | South Central Asia | 99.3 /100 | #49 | Exceptional 4.9% |
| French Canadians | 99.3 /100 | #50 | Exceptional 4.9% |
| Immigrants | Belgium | 99.2 /100 | #51 | Exceptional 4.9% |
| Whites/Caucasians | 99.2 /100 | #52 | Exceptional 4.9% |
| Immigrants | Zimbabwe | 99.2 /100 | #53 | Exceptional 4.9% |
| Eastern Europeans | 99.2 /100 | #54 | Exceptional 4.9% |
| Australians | 99.2 /100 | #55 | Exceptional 4.9% |
| Celtics | 99.1 /100 | #56 | Exceptional 4.9% |
Demographics Similar to Chippewa by Unemployment
In terms of unemployment, the demographic groups most similar to Chippewa are Senegalese (6.2%, a difference of 0.090%), Ecuadorian (6.2%, a difference of 0.35%), Nepalese (6.2%, a difference of 0.38%), Haitian (6.2%, a difference of 0.62%), and Central American Indian (6.2%, a difference of 0.64%).
| Demographics | Rating | Rank | Unemployment |
| Immigrants | Azores | 0.0 /100 | #282 | Tragic 6.1% |
| Immigrants | Ghana | 0.0 /100 | #283 | Tragic 6.1% |
| Aleuts | 0.0 /100 | #284 | Tragic 6.1% |
| Immigrants | Senegal | 0.0 /100 | #285 | Tragic 6.1% |
| Immigrants | Caribbean | 0.0 /100 | #286 | Tragic 6.2% |
| Nepalese | 0.0 /100 | #287 | Tragic 6.2% |
| Ecuadorians | 0.0 /100 | #288 | Tragic 6.2% |
| Chippewa | 0.0 /100 | #289 | Tragic 6.2% |
| Senegalese | 0.0 /100 | #290 | Tragic 6.2% |
| Haitians | 0.0 /100 | #291 | Tragic 6.2% |
| Central American Indians | 0.0 /100 | #292 | Tragic 6.2% |
| Immigrants | Ecuador | 0.0 /100 | #293 | Tragic 6.2% |
| Spanish American Indians | 0.0 /100 | #294 | Tragic 6.2% |
| U.S. Virgin Islanders | 0.0 /100 | #295 | Tragic 6.3% |
| Ute | 0.0 /100 | #296 | Tragic 6.3% |