Welsh vs Alaska Native Unemployment
COMPARE
Welsh
Alaska Native
Unemployment
Unemployment Comparison
Welsh
Alaska Natives
4.7%
UNEMPLOYMENT
99.9/ 100
METRIC RATING
21st/ 347
METRIC RANK
7.2%
UNEMPLOYMENT
0.0/ 100
METRIC RATING
329th/ 347
METRIC RANK
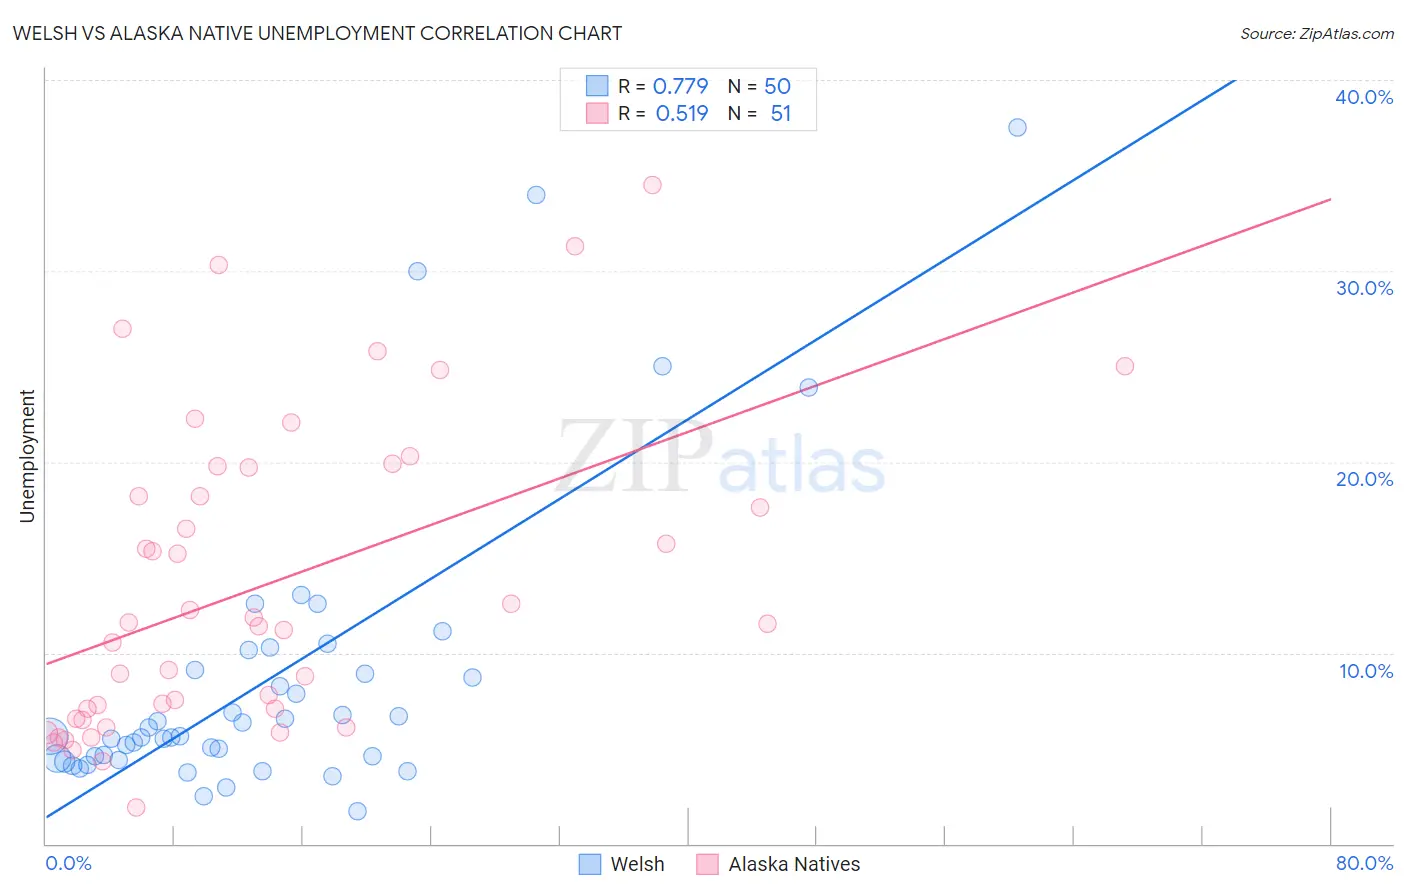
Welsh vs Alaska Native Unemployment Correlation Chart
The statistical analysis conducted on geographies consisting of 526,178,789 people shows a strong positive correlation between the proportion of Welsh and unemployment in the United States with a correlation coefficient (R) of 0.779 and weighted average of 4.7%. Similarly, the statistical analysis conducted on geographies consisting of 76,749,531 people shows a substantial positive correlation between the proportion of Alaska Natives and unemployment in the United States with a correlation coefficient (R) of 0.519 and weighted average of 7.2%, a difference of 54.3%.
Unemployment Correlation Summary
| Measurement | Welsh | Alaska Native |
| Minimum | 1.7% | 1.9% |
| Maximum | 37.5% | 34.5% |
| Range | 35.8% | 32.6% |
| Mean | 8.7% | 13.5% |
| Median | 5.6% | 11.5% |
| Interquartile 25% (IQ1) | 4.5% | 6.6% |
| Interquartile 75% (IQ3) | 9.1% | 19.7% |
| Interquartile Range (IQR) | 4.7% | 13.1% |
| Standard Deviation (Sample) | 7.8% | 8.0% |
| Standard Deviation (Population) | 7.8% | 8.0% |
Similar Demographics by Unemployment
Demographics Similar to Welsh by Unemployment
In terms of unemployment, the demographic groups most similar to Welsh are Thai (4.7%, a difference of 0.0%), Carpatho Rusyn (4.7%, a difference of 0.020%), British (4.7%, a difference of 0.30%), Venezuelan (4.7%, a difference of 0.38%), and Latvian (4.7%, a difference of 0.45%).
| Demographics | Rating | Rank | Unemployment |
| Immigrants | Cuba | 100.0 /100 | #14 | Exceptional 4.6% |
| Europeans | 99.9 /100 | #15 | Exceptional 4.6% |
| Chinese | 99.9 /100 | #16 | Exceptional 4.7% |
| Slovenes | 99.9 /100 | #17 | Exceptional 4.7% |
| Immigrants | Venezuela | 99.9 /100 | #18 | Exceptional 4.7% |
| Scottish | 99.9 /100 | #19 | Exceptional 4.7% |
| Carpatho Rusyns | 99.9 /100 | #20 | Exceptional 4.7% |
| Welsh | 99.9 /100 | #21 | Exceptional 4.7% |
| Thais | 99.9 /100 | #22 | Exceptional 4.7% |
| British | 99.9 /100 | #23 | Exceptional 4.7% |
| Venezuelans | 99.9 /100 | #24 | Exceptional 4.7% |
| Latvians | 99.9 /100 | #25 | Exceptional 4.7% |
| Bulgarians | 99.9 /100 | #26 | Exceptional 4.7% |
| Finns | 99.9 /100 | #27 | Exceptional 4.7% |
| Cubans | 99.8 /100 | #28 | Exceptional 4.7% |
Demographics Similar to Alaska Natives by Unemployment
In terms of unemployment, the demographic groups most similar to Alaska Natives are Tsimshian (7.2%, a difference of 0.31%), Pueblo (7.2%, a difference of 1.2%), Yakama (7.3%, a difference of 1.3%), Dominican (7.4%, a difference of 1.6%), and Paiute (7.1%, a difference of 1.8%).
| Demographics | Rating | Rank | Unemployment |
| Guyanese | 0.0 /100 | #322 | Tragic 6.9% |
| Immigrants | Grenada | 0.0 /100 | #323 | Tragic 6.9% |
| Immigrants | Armenia | 0.0 /100 | #324 | Tragic 7.0% |
| Natives/Alaskans | 0.0 /100 | #325 | Tragic 7.0% |
| Paiute | 0.0 /100 | #326 | Tragic 7.1% |
| Pueblo | 0.0 /100 | #327 | Tragic 7.2% |
| Tsimshian | 0.0 /100 | #328 | Tragic 7.2% |
| Alaska Natives | 0.0 /100 | #329 | Tragic 7.2% |
| Yakama | 0.0 /100 | #330 | Tragic 7.3% |
| Dominicans | 0.0 /100 | #331 | Tragic 7.4% |
| Sioux | 0.0 /100 | #332 | Tragic 7.4% |
| Immigrants | Dominican Republic | 0.0 /100 | #333 | Tragic 7.4% |
| Apache | 0.0 /100 | #334 | Tragic 7.4% |
| Alaskan Athabascans | 0.0 /100 | #335 | Tragic 7.7% |
| Immigrants | Yemen | 0.0 /100 | #336 | Tragic 7.7% |