Immigrants from Northern Europe vs Immigrants from Poland Unemployment
COMPARE
Immigrants from Northern Europe
Immigrants from Poland
Unemployment
Unemployment Comparison
Immigrants from Northern Europe
Immigrants from Poland
4.9%
UNEMPLOYMENT
98.2/ 100
METRIC RATING
74th/ 347
METRIC RANK
5.3%
UNEMPLOYMENT
51.8/ 100
METRIC RATING
173rd/ 347
METRIC RANK
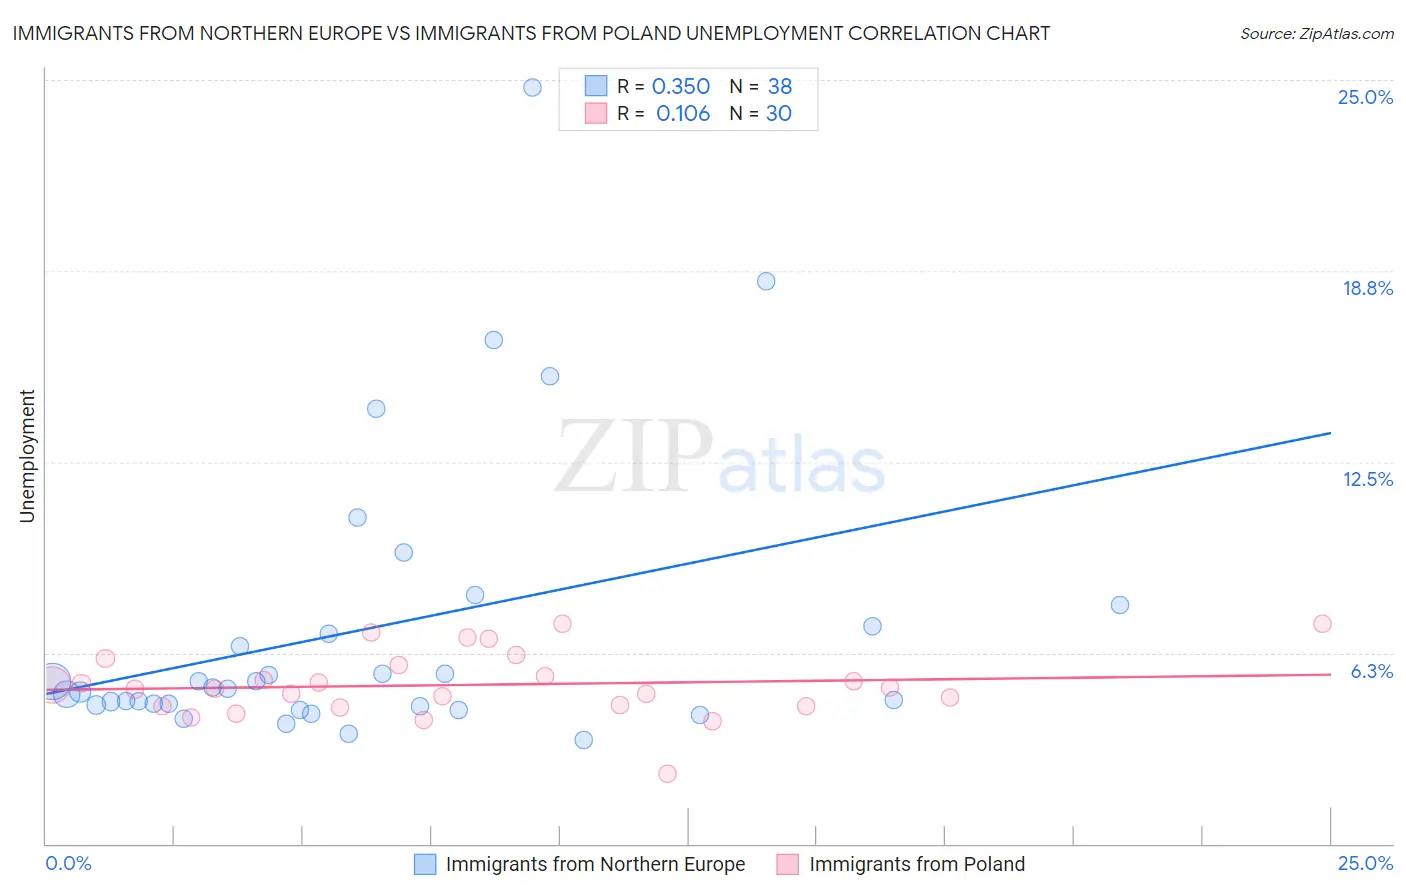
Immigrants from Northern Europe vs Immigrants from Poland Unemployment Correlation Chart
The statistical analysis conducted on geographies consisting of 476,230,323 people shows a mild positive correlation between the proportion of Immigrants from Northern Europe and unemployment in the United States with a correlation coefficient (R) of 0.350 and weighted average of 4.9%. Similarly, the statistical analysis conducted on geographies consisting of 304,663,845 people shows a poor positive correlation between the proportion of Immigrants from Poland and unemployment in the United States with a correlation coefficient (R) of 0.106 and weighted average of 5.3%, a difference of 6.4%.
Unemployment Correlation Summary
| Measurement | Immigrants from Northern Europe | Immigrants from Poland |
| Minimum | 3.4% | 2.3% |
| Maximum | 24.8% | 7.2% |
| Range | 21.4% | 4.9% |
| Mean | 7.0% | 5.2% |
| Median | 5.1% | 5.1% |
| Interquartile 25% (IQ1) | 4.5% | 4.5% |
| Interquartile 75% (IQ3) | 7.1% | 5.8% |
| Interquartile Range (IQR) | 2.6% | 1.3% |
| Standard Deviation (Sample) | 4.7% | 1.1% |
| Standard Deviation (Population) | 4.7% | 1.1% |
Similar Demographics by Unemployment
Demographics Similar to Immigrants from Northern Europe by Unemployment
In terms of unemployment, the demographic groups most similar to Immigrants from Northern Europe are Paraguayan (4.9%, a difference of 0.090%), Turkish (4.9%, a difference of 0.13%), Burmese (4.9%, a difference of 0.14%), Immigrants from Japan (4.9%, a difference of 0.16%), and German Russian (4.9%, a difference of 0.16%).
| Demographics | Rating | Rank | Unemployment |
| New Zealanders | 98.6 /100 | #67 | Exceptional 4.9% |
| Slavs | 98.6 /100 | #68 | Exceptional 4.9% |
| Immigrants | North America | 98.5 /100 | #69 | Exceptional 4.9% |
| Serbians | 98.4 /100 | #70 | Exceptional 4.9% |
| Immigrants | Japan | 98.3 /100 | #71 | Exceptional 4.9% |
| Burmese | 98.3 /100 | #72 | Exceptional 4.9% |
| Paraguayans | 98.3 /100 | #73 | Exceptional 4.9% |
| Immigrants | Northern Europe | 98.2 /100 | #74 | Exceptional 4.9% |
| Turks | 98.0 /100 | #75 | Exceptional 4.9% |
| German Russians | 98.0 /100 | #76 | Exceptional 4.9% |
| Cypriots | 97.9 /100 | #77 | Exceptional 4.9% |
| Okinawans | 97.9 /100 | #78 | Exceptional 4.9% |
| Canadians | 97.7 /100 | #79 | Exceptional 5.0% |
| Immigrants | Sweden | 97.6 /100 | #80 | Exceptional 5.0% |
| Basques | 97.6 /100 | #81 | Exceptional 5.0% |
Demographics Similar to Immigrants from Poland by Unemployment
In terms of unemployment, the demographic groups most similar to Immigrants from Poland are Immigrants from Vietnam (5.2%, a difference of 0.040%), Immigrants from Congo (5.3%, a difference of 0.11%), Taiwanese (5.3%, a difference of 0.13%), Nicaraguan (5.3%, a difference of 0.19%), and Nonimmigrants (5.3%, a difference of 0.24%).
| Demographics | Rating | Rank | Unemployment |
| Immigrants | Indonesia | 61.2 /100 | #166 | Good 5.2% |
| Colombians | 61.1 /100 | #167 | Good 5.2% |
| Uruguayans | 60.2 /100 | #168 | Good 5.2% |
| Immigrants | Morocco | 59.1 /100 | #169 | Average 5.2% |
| Immigrants | Nicaragua | 57.1 /100 | #170 | Average 5.2% |
| Puget Sound Salish | 56.6 /100 | #171 | Average 5.2% |
| Immigrants | Vietnam | 52.5 /100 | #172 | Average 5.2% |
| Immigrants | Poland | 51.8 /100 | #173 | Average 5.3% |
| Immigrants | Congo | 50.0 /100 | #174 | Average 5.3% |
| Taiwanese | 49.6 /100 | #175 | Average 5.3% |
| Nicaraguans | 48.7 /100 | #176 | Average 5.3% |
| Immigrants | Nonimmigrants | 47.9 /100 | #177 | Average 5.3% |
| Afghans | 47.4 /100 | #178 | Average 5.3% |
| Malaysians | 46.8 /100 | #179 | Average 5.3% |
| Immigrants | Greece | 45.0 /100 | #180 | Average 5.3% |