Welsh vs Palestinian Unemployment
COMPARE
Welsh
Palestinian
Unemployment
Unemployment Comparison
Welsh
Palestinians
4.7%
UNEMPLOYMENT
99.9/ 100
METRIC RATING
21st/ 347
METRIC RANK
5.1%
UNEMPLOYMENT
83.4/ 100
METRIC RATING
141st/ 347
METRIC RANK
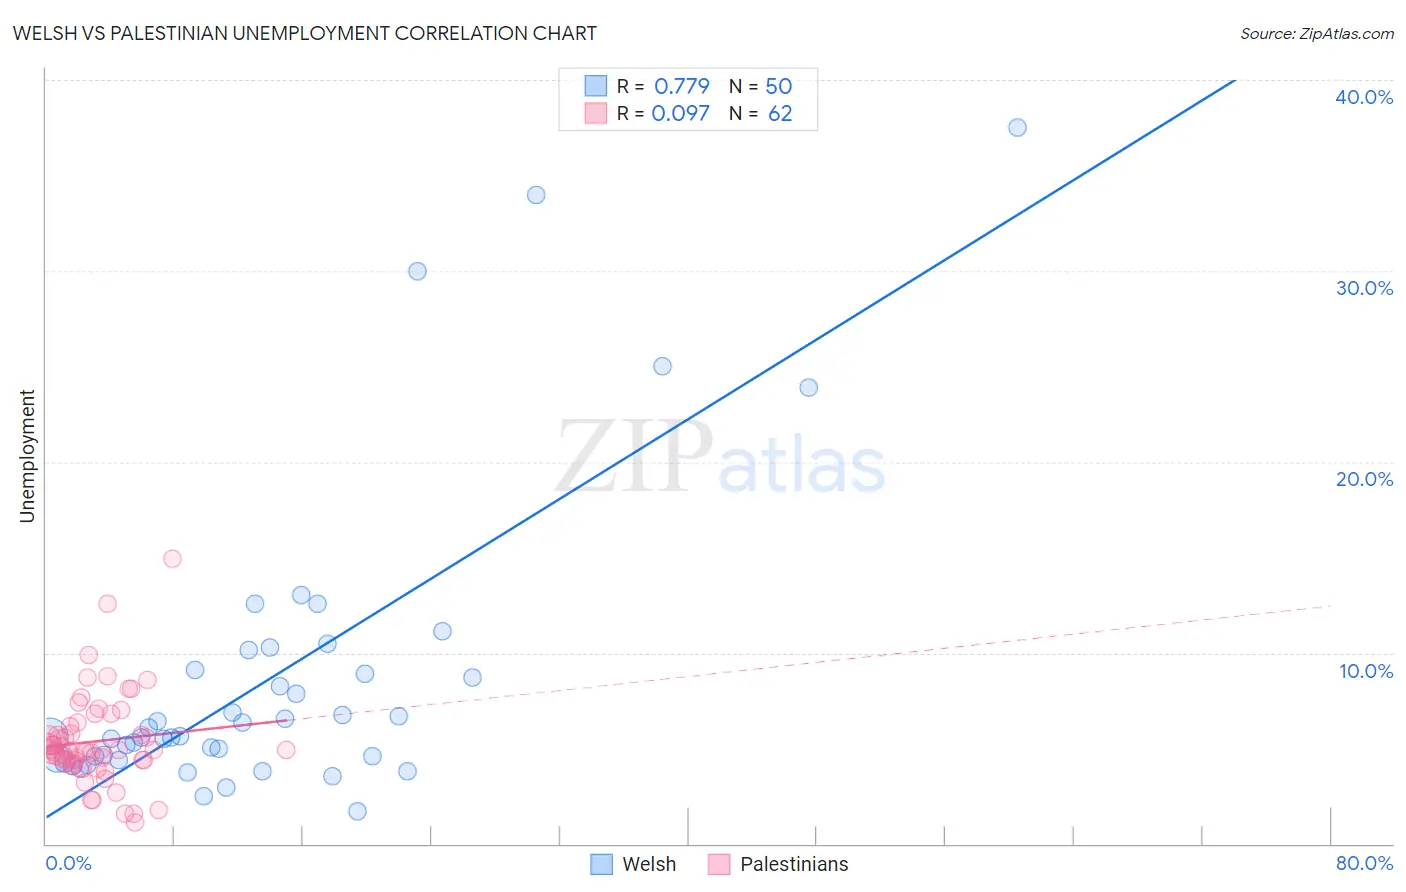
Welsh vs Palestinian Unemployment Correlation Chart
The statistical analysis conducted on geographies consisting of 526,178,789 people shows a strong positive correlation between the proportion of Welsh and unemployment in the United States with a correlation coefficient (R) of 0.779 and weighted average of 4.7%. Similarly, the statistical analysis conducted on geographies consisting of 216,422,149 people shows a slight positive correlation between the proportion of Palestinians and unemployment in the United States with a correlation coefficient (R) of 0.097 and weighted average of 5.1%, a difference of 9.3%.
Unemployment Correlation Summary
| Measurement | Welsh | Palestinian |
| Minimum | 1.7% | 1.1% |
| Maximum | 37.5% | 14.9% |
| Range | 35.8% | 13.8% |
| Mean | 8.7% | 5.4% |
| Median | 5.6% | 4.9% |
| Interquartile 25% (IQ1) | 4.5% | 4.4% |
| Interquartile 75% (IQ3) | 9.1% | 6.2% |
| Interquartile Range (IQR) | 4.7% | 1.8% |
| Standard Deviation (Sample) | 7.8% | 2.4% |
| Standard Deviation (Population) | 7.8% | 2.4% |
Similar Demographics by Unemployment
Demographics Similar to Welsh by Unemployment
In terms of unemployment, the demographic groups most similar to Welsh are Thai (4.7%, a difference of 0.0%), Carpatho Rusyn (4.7%, a difference of 0.020%), British (4.7%, a difference of 0.30%), Venezuelan (4.7%, a difference of 0.38%), and Latvian (4.7%, a difference of 0.45%).
| Demographics | Rating | Rank | Unemployment |
| Immigrants | Cuba | 100.0 /100 | #14 | Exceptional 4.6% |
| Europeans | 99.9 /100 | #15 | Exceptional 4.6% |
| Chinese | 99.9 /100 | #16 | Exceptional 4.7% |
| Slovenes | 99.9 /100 | #17 | Exceptional 4.7% |
| Immigrants | Venezuela | 99.9 /100 | #18 | Exceptional 4.7% |
| Scottish | 99.9 /100 | #19 | Exceptional 4.7% |
| Carpatho Rusyns | 99.9 /100 | #20 | Exceptional 4.7% |
| Welsh | 99.9 /100 | #21 | Exceptional 4.7% |
| Thais | 99.9 /100 | #22 | Exceptional 4.7% |
| British | 99.9 /100 | #23 | Exceptional 4.7% |
| Venezuelans | 99.9 /100 | #24 | Exceptional 4.7% |
| Latvians | 99.9 /100 | #25 | Exceptional 4.7% |
| Bulgarians | 99.9 /100 | #26 | Exceptional 4.7% |
| Finns | 99.9 /100 | #27 | Exceptional 4.7% |
| Cubans | 99.8 /100 | #28 | Exceptional 4.7% |
Demographics Similar to Palestinians by Unemployment
In terms of unemployment, the demographic groups most similar to Palestinians are Immigrants from Pakistan (5.1%, a difference of 0.020%), Immigrants from Chile (5.1%, a difference of 0.070%), Immigrants from Denmark (5.1%, a difference of 0.11%), Indonesian (5.1%, a difference of 0.12%), and Immigrants from Norway (5.1%, a difference of 0.17%).
| Demographics | Rating | Rank | Unemployment |
| Immigrants | Europe | 86.3 /100 | #134 | Excellent 5.1% |
| Immigrants | Burma/Myanmar | 86.2 /100 | #135 | Excellent 5.1% |
| Immigrants | Spain | 86.2 /100 | #136 | Excellent 5.1% |
| Immigrants | Saudi Arabia | 85.6 /100 | #137 | Excellent 5.1% |
| Immigrants | Hungary | 85.6 /100 | #138 | Excellent 5.1% |
| Pakistanis | 85.3 /100 | #139 | Excellent 5.1% |
| Immigrants | Denmark | 84.3 /100 | #140 | Excellent 5.1% |
| Palestinians | 83.4 /100 | #141 | Excellent 5.1% |
| Immigrants | Pakistan | 83.2 /100 | #142 | Excellent 5.1% |
| Immigrants | Chile | 82.8 /100 | #143 | Excellent 5.1% |
| Indonesians | 82.3 /100 | #144 | Excellent 5.1% |
| Immigrants | Norway | 81.8 /100 | #145 | Excellent 5.1% |
| Immigrants | Asia | 81.8 /100 | #146 | Excellent 5.1% |
| Indians (Asian) | 81.6 /100 | #147 | Excellent 5.1% |
| Immigrants | Italy | 79.1 /100 | #148 | Good 5.1% |