Mongolian vs Immigrants from Poland Unemployment
COMPARE
Mongolian
Immigrants from Poland
Unemployment
Unemployment Comparison
Mongolians
Immigrants from Poland
5.0%
UNEMPLOYMENT
94.8/ 100
METRIC RATING
99th/ 347
METRIC RANK
5.3%
UNEMPLOYMENT
51.8/ 100
METRIC RATING
173rd/ 347
METRIC RANK
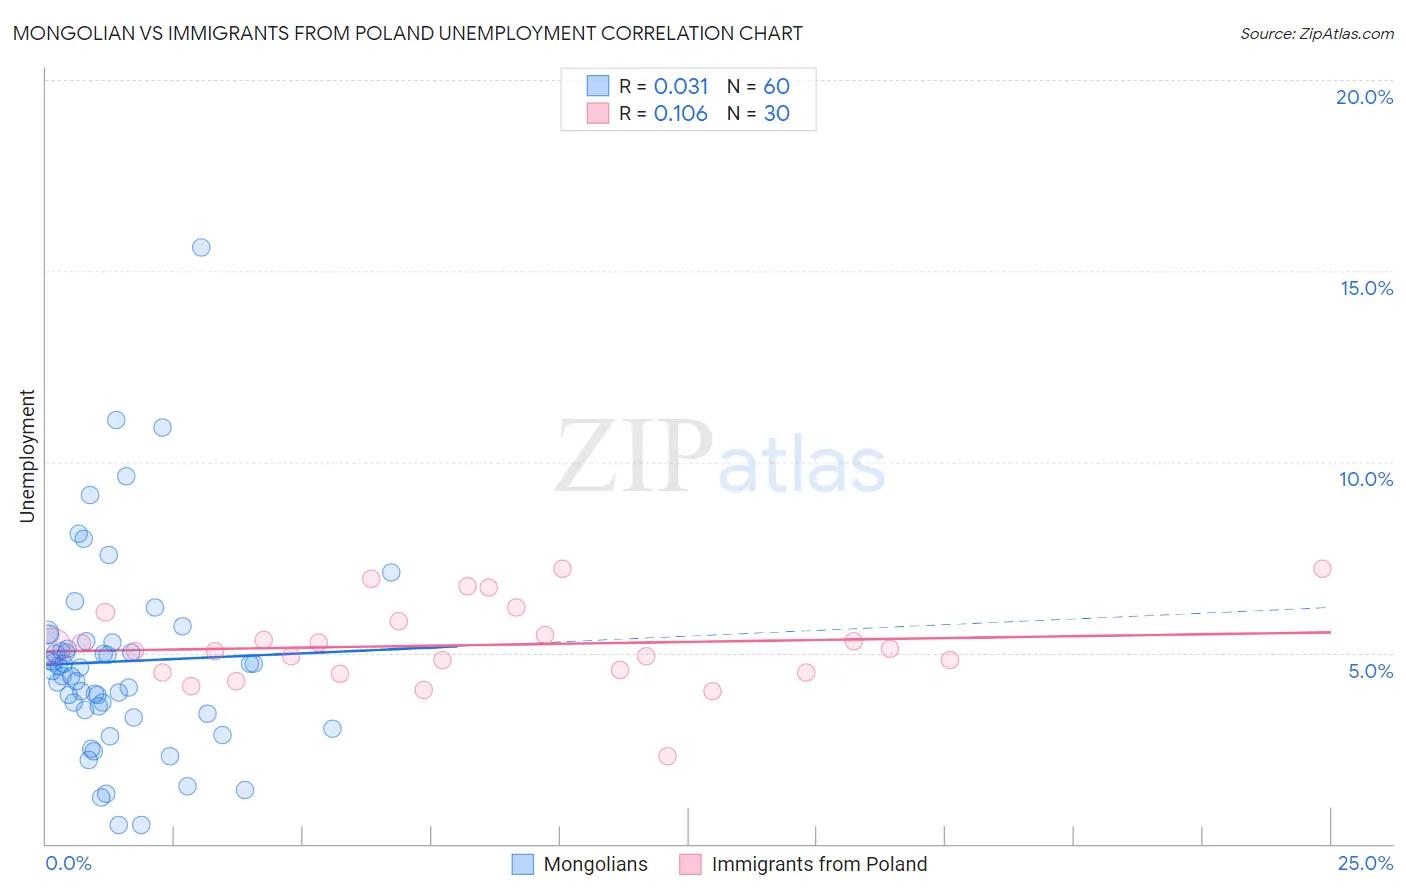
Mongolian vs Immigrants from Poland Unemployment Correlation Chart
The statistical analysis conducted on geographies consisting of 140,354,726 people shows no correlation between the proportion of Mongolians and unemployment in the United States with a correlation coefficient (R) of 0.031 and weighted average of 5.0%. Similarly, the statistical analysis conducted on geographies consisting of 304,663,845 people shows a poor positive correlation between the proportion of Immigrants from Poland and unemployment in the United States with a correlation coefficient (R) of 0.106 and weighted average of 5.3%, a difference of 4.5%.
Unemployment Correlation Summary
| Measurement | Mongolian | Immigrants from Poland |
| Minimum | 0.50% | 2.3% |
| Maximum | 15.6% | 7.2% |
| Range | 15.1% | 4.9% |
| Mean | 4.8% | 5.2% |
| Median | 4.6% | 5.1% |
| Interquartile 25% (IQ1) | 3.5% | 4.5% |
| Interquartile 75% (IQ3) | 5.3% | 5.8% |
| Interquartile Range (IQR) | 1.8% | 1.3% |
| Standard Deviation (Sample) | 2.6% | 1.1% |
| Standard Deviation (Population) | 2.6% | 1.1% |
Similar Demographics by Unemployment
Demographics Similar to Mongolians by Unemployment
In terms of unemployment, the demographic groups most similar to Mongolians are Estonian (5.0%, a difference of 0.060%), Romanian (5.0%, a difference of 0.070%), Immigrants from Czechoslovakia (5.0%, a difference of 0.10%), Immigrants from England (5.0%, a difference of 0.13%), and American (5.0%, a difference of 0.15%).
| Demographics | Rating | Rank | Unemployment |
| Immigrants | South Africa | 96.2 /100 | #92 | Exceptional 5.0% |
| Ukrainians | 96.0 /100 | #93 | Exceptional 5.0% |
| Immigrants | Austria | 95.9 /100 | #94 | Exceptional 5.0% |
| Immigrants | Serbia | 95.6 /100 | #95 | Exceptional 5.0% |
| Immigrants | England | 95.2 /100 | #96 | Exceptional 5.0% |
| Immigrants | Czechoslovakia | 95.1 /100 | #97 | Exceptional 5.0% |
| Romanians | 95.0 /100 | #98 | Exceptional 5.0% |
| Mongolians | 94.8 /100 | #99 | Exceptional 5.0% |
| Estonians | 94.6 /100 | #100 | Exceptional 5.0% |
| Americans | 94.3 /100 | #101 | Exceptional 5.0% |
| Immigrants | Argentina | 94.1 /100 | #102 | Exceptional 5.0% |
| Chickasaw | 94.0 /100 | #103 | Exceptional 5.0% |
| Osage | 94.0 /100 | #104 | Exceptional 5.0% |
| Maltese | 94.0 /100 | #105 | Exceptional 5.0% |
| Immigrants | Romania | 93.7 /100 | #106 | Exceptional 5.0% |
Demographics Similar to Immigrants from Poland by Unemployment
In terms of unemployment, the demographic groups most similar to Immigrants from Poland are Immigrants from Vietnam (5.2%, a difference of 0.040%), Immigrants from Congo (5.3%, a difference of 0.11%), Taiwanese (5.3%, a difference of 0.13%), Nicaraguan (5.3%, a difference of 0.19%), and Nonimmigrants (5.3%, a difference of 0.24%).
| Demographics | Rating | Rank | Unemployment |
| Immigrants | Indonesia | 61.2 /100 | #166 | Good 5.2% |
| Colombians | 61.1 /100 | #167 | Good 5.2% |
| Uruguayans | 60.2 /100 | #168 | Good 5.2% |
| Immigrants | Morocco | 59.1 /100 | #169 | Average 5.2% |
| Immigrants | Nicaragua | 57.1 /100 | #170 | Average 5.2% |
| Puget Sound Salish | 56.6 /100 | #171 | Average 5.2% |
| Immigrants | Vietnam | 52.5 /100 | #172 | Average 5.2% |
| Immigrants | Poland | 51.8 /100 | #173 | Average 5.3% |
| Immigrants | Congo | 50.0 /100 | #174 | Average 5.3% |
| Taiwanese | 49.6 /100 | #175 | Average 5.3% |
| Nicaraguans | 48.7 /100 | #176 | Average 5.3% |
| Immigrants | Nonimmigrants | 47.9 /100 | #177 | Average 5.3% |
| Afghans | 47.4 /100 | #178 | Average 5.3% |
| Malaysians | 46.8 /100 | #179 | Average 5.3% |
| Immigrants | Greece | 45.0 /100 | #180 | Average 5.3% |