Vietnamese vs Colville Unemployment Among Women with Children Ages 6 to 17 years
COMPARE
Vietnamese
Colville
Unemployment Among Women with Children Ages 6 to 17 years
Unemployment Among Women with Children Ages 6 to 17 years Comparison
Vietnamese
Colville
8.9%
UNEMPLOYMENT AMONG WOMEN WITH CHILDREN AGES 6 TO 17 YEARS
72.1/ 100
METRIC RATING
154th/ 347
METRIC RANK
12.3%
UNEMPLOYMENT AMONG WOMEN WITH CHILDREN AGES 6 TO 17 YEARS
0.0/ 100
METRIC RATING
335th/ 347
METRIC RANK
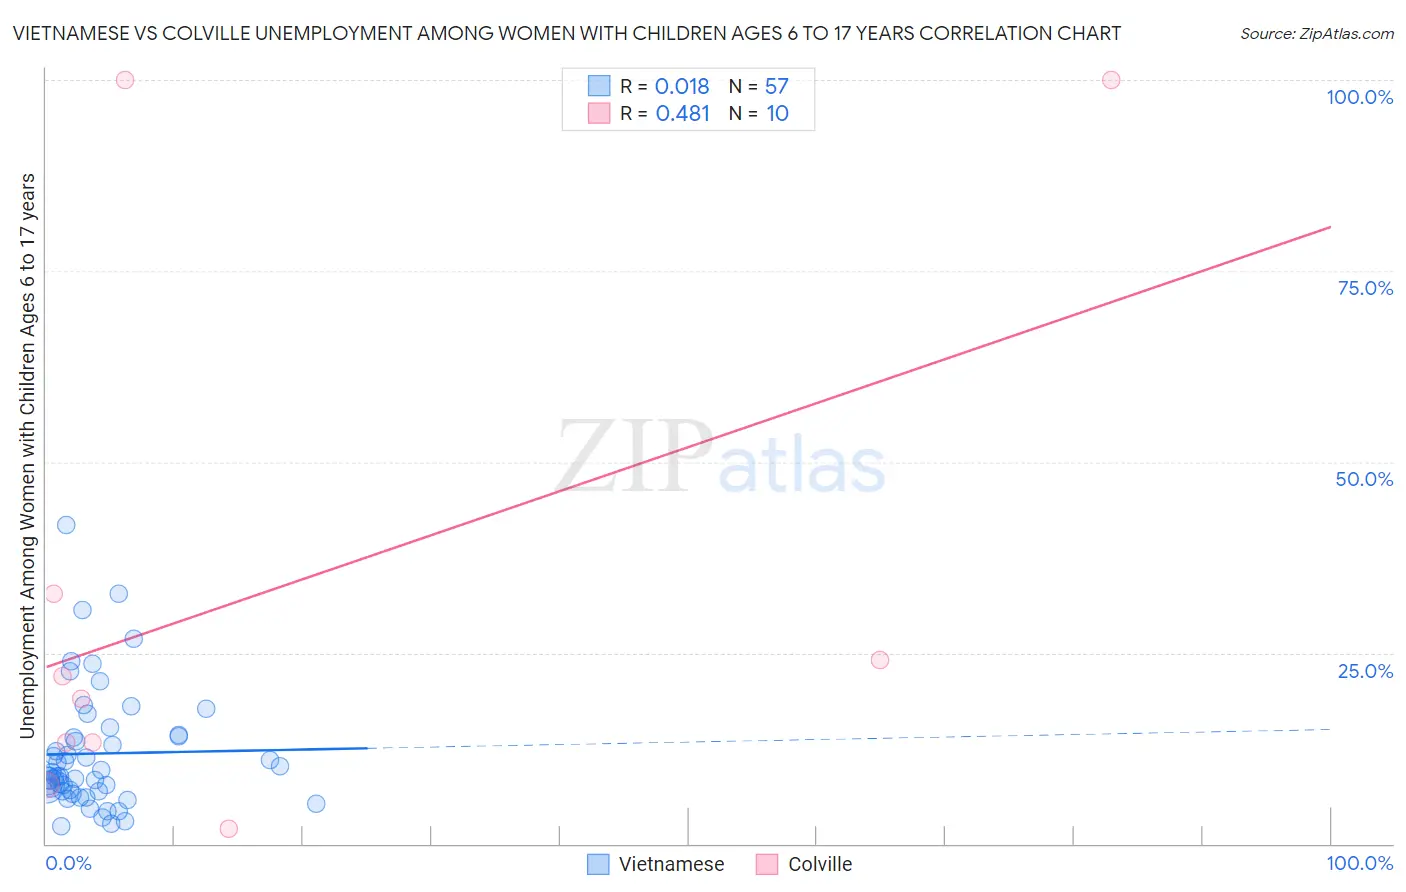
Vietnamese vs Colville Unemployment Among Women with Children Ages 6 to 17 years Correlation Chart
The statistical analysis conducted on geographies consisting of 144,141,826 people shows no correlation between the proportion of Vietnamese and unemployment rate among women with children between the ages 6 and 17 in the United States with a correlation coefficient (R) of 0.018 and weighted average of 8.9%. Similarly, the statistical analysis conducted on geographies consisting of 31,705,481 people shows a moderate positive correlation between the proportion of Colville and unemployment rate among women with children between the ages 6 and 17 in the United States with a correlation coefficient (R) of 0.481 and weighted average of 12.3%, a difference of 39.2%.
Unemployment Among Women with Children Ages 6 to 17 years Correlation Summary
| Measurement | Vietnamese | Colville |
| Minimum | 2.4% | 2.0% |
| Maximum | 41.7% | 100.0% |
| Range | 39.3% | 98.0% |
| Mean | 11.8% | 33.4% |
| Median | 8.8% | 20.5% |
| Interquartile 25% (IQ1) | 6.9% | 13.3% |
| Interquartile 75% (IQ3) | 14.2% | 32.7% |
| Interquartile Range (IQR) | 7.3% | 19.4% |
| Standard Deviation (Sample) | 7.9% | 36.1% |
| Standard Deviation (Population) | 7.9% | 34.3% |
Similar Demographics by Unemployment Among Women with Children Ages 6 to 17 years
Demographics Similar to Vietnamese by Unemployment Among Women with Children Ages 6 to 17 years
In terms of unemployment among women with children ages 6 to 17 years, the demographic groups most similar to Vietnamese are Immigrants from Greece (8.9%, a difference of 0.020%), Immigrants from Europe (8.9%, a difference of 0.070%), Immigrants from Eastern Africa (8.9%, a difference of 0.14%), Immigrants from Northern Europe (8.9%, a difference of 0.14%), and Greek (8.9%, a difference of 0.18%).
| Demographics | Rating | Rank | Unemployment Among Women with Children Ages 6 to 17 years |
| Immigrants | Bangladesh | 79.4 /100 | #147 | Good 8.8% |
| Costa Ricans | 77.0 /100 | #148 | Good 8.8% |
| Croatians | 76.0 /100 | #149 | Good 8.8% |
| Greeks | 75.2 /100 | #150 | Good 8.9% |
| Immigrants | Eastern Africa | 74.6 /100 | #151 | Good 8.9% |
| Immigrants | Northern Europe | 74.6 /100 | #152 | Good 8.9% |
| Immigrants | Europe | 73.4 /100 | #153 | Good 8.9% |
| Vietnamese | 72.1 /100 | #154 | Good 8.9% |
| Immigrants | Greece | 71.8 /100 | #155 | Good 8.9% |
| Osage | 65.9 /100 | #156 | Good 8.9% |
| Immigrants | Belgium | 65.6 /100 | #157 | Good 8.9% |
| Immigrants | Chile | 65.3 /100 | #158 | Good 8.9% |
| Spanish | 63.8 /100 | #159 | Good 8.9% |
| Immigrants | Hungary | 63.4 /100 | #160 | Good 8.9% |
| Immigrants | Guyana | 63.0 /100 | #161 | Good 8.9% |
Demographics Similar to Colville by Unemployment Among Women with Children Ages 6 to 17 years
In terms of unemployment among women with children ages 6 to 17 years, the demographic groups most similar to Colville are Houma (12.5%, a difference of 0.97%), Ugandan (12.0%, a difference of 2.7%), Immigrants from Yemen (12.7%, a difference of 2.9%), Hopi (12.9%, a difference of 4.4%), and Sioux (13.2%, a difference of 7.2%).
| Demographics | Rating | Rank | Unemployment Among Women with Children Ages 6 to 17 years |
| Ottawa | 0.0 /100 | #328 | Tragic 10.9% |
| Pennsylvania Germans | 0.0 /100 | #329 | Tragic 11.0% |
| Chippewa | 0.0 /100 | #330 | Tragic 11.1% |
| Blacks/African Americans | 0.0 /100 | #331 | Tragic 11.4% |
| Tsimshian | 0.0 /100 | #332 | Tragic 11.4% |
| Natives/Alaskans | 0.0 /100 | #333 | Tragic 11.5% |
| Ugandans | 0.0 /100 | #334 | Tragic 12.0% |
| Colville | 0.0 /100 | #335 | Tragic 12.3% |
| Houma | 0.0 /100 | #336 | Tragic 12.5% |
| Immigrants | Yemen | 0.0 /100 | #337 | Tragic 12.7% |
| Hopi | 0.0 /100 | #338 | Tragic 12.9% |
| Sioux | 0.0 /100 | #339 | Tragic 13.2% |
| Puerto Ricans | 0.0 /100 | #340 | Tragic 13.9% |
| Navajo | 0.0 /100 | #341 | Tragic 14.2% |
| Yuman | 0.0 /100 | #342 | Tragic 14.8% |