Vietnamese vs Jordanian Unemployment Among Women with Children Ages 6 to 17 years
COMPARE
Vietnamese
Jordanian
Unemployment Among Women with Children Ages 6 to 17 years
Unemployment Among Women with Children Ages 6 to 17 years Comparison
Vietnamese
Jordanians
8.9%
UNEMPLOYMENT AMONG WOMEN WITH CHILDREN AGES 6 TO 17 YEARS
72.1/ 100
METRIC RATING
154th/ 347
METRIC RANK
9.0%
UNEMPLOYMENT AMONG WOMEN WITH CHILDREN AGES 6 TO 17 YEARS
52.2/ 100
METRIC RATING
171st/ 347
METRIC RANK
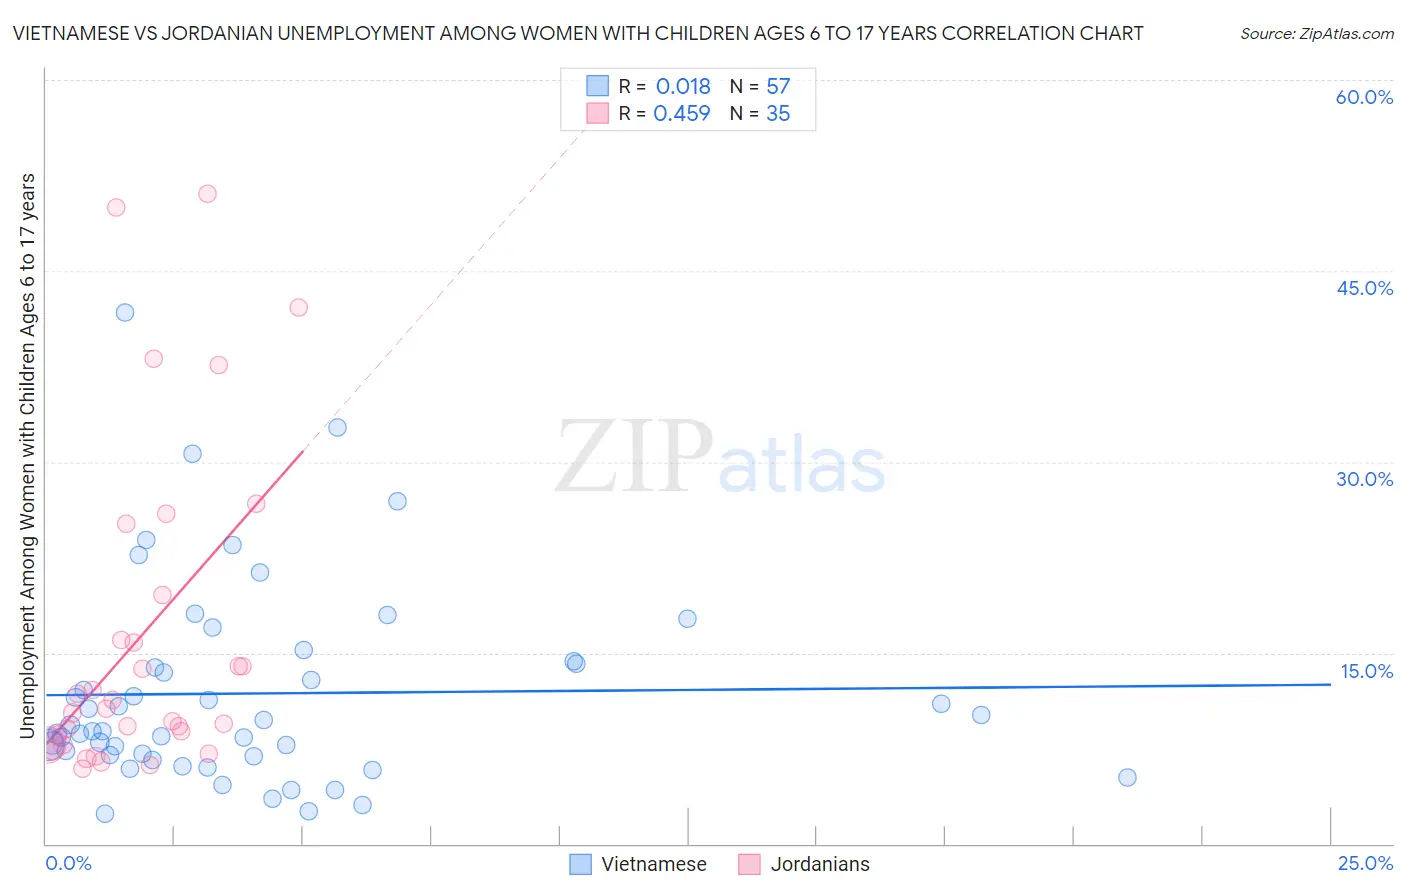
Vietnamese vs Jordanian Unemployment Among Women with Children Ages 6 to 17 years Correlation Chart
The statistical analysis conducted on geographies consisting of 144,141,826 people shows no correlation between the proportion of Vietnamese and unemployment rate among women with children between the ages 6 and 17 in the United States with a correlation coefficient (R) of 0.018 and weighted average of 8.9%. Similarly, the statistical analysis conducted on geographies consisting of 139,824,688 people shows a moderate positive correlation between the proportion of Jordanians and unemployment rate among women with children between the ages 6 and 17 in the United States with a correlation coefficient (R) of 0.459 and weighted average of 9.0%, a difference of 0.97%.
Unemployment Among Women with Children Ages 6 to 17 years Correlation Summary
| Measurement | Vietnamese | Jordanian |
| Minimum | 2.4% | 5.9% |
| Maximum | 41.7% | 51.1% |
| Range | 39.3% | 45.2% |
| Mean | 11.8% | 16.3% |
| Median | 8.8% | 10.6% |
| Interquartile 25% (IQ1) | 6.9% | 7.8% |
| Interquartile 75% (IQ3) | 14.2% | 19.5% |
| Interquartile Range (IQR) | 7.3% | 11.7% |
| Standard Deviation (Sample) | 7.9% | 12.8% |
| Standard Deviation (Population) | 7.9% | 12.6% |
Demographics Similar to Vietnamese and Jordanians by Unemployment Among Women with Children Ages 6 to 17 years
In terms of unemployment among women with children ages 6 to 17 years, the demographic groups most similar to Vietnamese are Immigrants from Greece (8.9%, a difference of 0.020%), Immigrants from Europe (8.9%, a difference of 0.070%), Immigrants from Northern Europe (8.9%, a difference of 0.14%), Osage (8.9%, a difference of 0.32%), and Immigrants from Belgium (8.9%, a difference of 0.34%). Similarly, the demographic groups most similar to Jordanians are Immigrants from West Indies (9.0%, a difference of 0.0%), Turkish (8.9%, a difference of 0.090%), British (8.9%, a difference of 0.14%), Immigrants from Croatia (8.9%, a difference of 0.22%), and Immigrants from England (8.9%, a difference of 0.25%).
| Demographics | Rating | Rank | Unemployment Among Women with Children Ages 6 to 17 years |
| Immigrants | Northern Europe | 74.6 /100 | #152 | Good 8.9% |
| Immigrants | Europe | 73.4 /100 | #153 | Good 8.9% |
| Vietnamese | 72.1 /100 | #154 | Good 8.9% |
| Immigrants | Greece | 71.8 /100 | #155 | Good 8.9% |
| Osage | 65.9 /100 | #156 | Good 8.9% |
| Immigrants | Belgium | 65.6 /100 | #157 | Good 8.9% |
| Immigrants | Chile | 65.3 /100 | #158 | Good 8.9% |
| Spanish | 63.8 /100 | #159 | Good 8.9% |
| Immigrants | Hungary | 63.4 /100 | #160 | Good 8.9% |
| Immigrants | Guyana | 63.0 /100 | #161 | Good 8.9% |
| Immigrants | Netherlands | 60.8 /100 | #162 | Good 8.9% |
| Mexican American Indians | 60.6 /100 | #163 | Good 8.9% |
| Ukrainians | 59.7 /100 | #164 | Average 8.9% |
| Immigrants | Micronesia | 59.2 /100 | #165 | Average 8.9% |
| Moroccans | 58.3 /100 | #166 | Average 8.9% |
| Immigrants | England | 57.7 /100 | #167 | Average 8.9% |
| Immigrants | Croatia | 57.1 /100 | #168 | Average 8.9% |
| British | 55.2 /100 | #169 | Average 8.9% |
| Turks | 54.1 /100 | #170 | Average 8.9% |
| Jordanians | 52.2 /100 | #171 | Average 9.0% |
| Immigrants | West Indies | 52.2 /100 | #172 | Average 9.0% |